
| Area | Basinwide/General |
| Topic | Climate: Peak Daily Rainfall Willits |
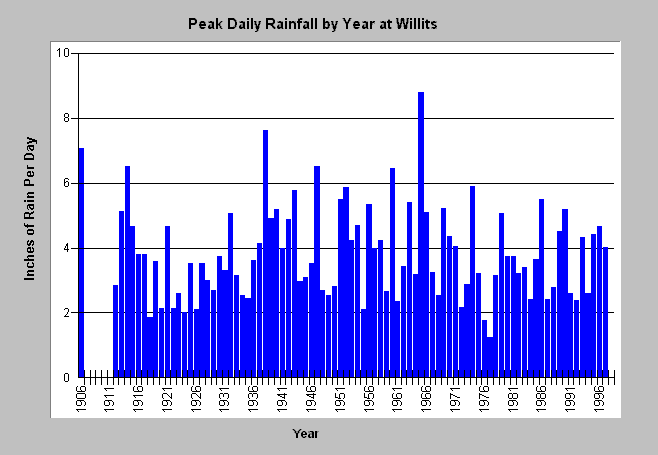
| Caption: The graph above shows peak daily rainfall in inches by year at Willits, California from 1906 to 1999. Daily rainfall totals are not available for the entire period of the gauge record (1898-1999). Rainfall at Willits seems to be more indicative of high flows on the Noyo River than rainfall at Ft. Bragg. The 1964 flood event was marked by the highest daily rainfall (8.8 inches) on record at Willits. The highest flows of the Noyo were in 1974, when a peak daily rainfall of 5.9 inches was recorded. Matthews postulates that 1974 may have been an unusual rain on snow event in the upper Noyo Basin. Data taken from Matthews (1999) Sediment Source Analysis and Preliminary Sediment Budget for the Noyo River. | |
 |
To learn more about this topic click here .
To view the table with the chart's data, click Chart Table web page.
To download the table with the chart's data, click precipintensity.dbf (size 2,734 bytes) .
To see meta information about the data table used for this topic click here
| www.krisweb.com |