
| Area | Basinwide/General |
| Topic | Tour: Matthews Maps |
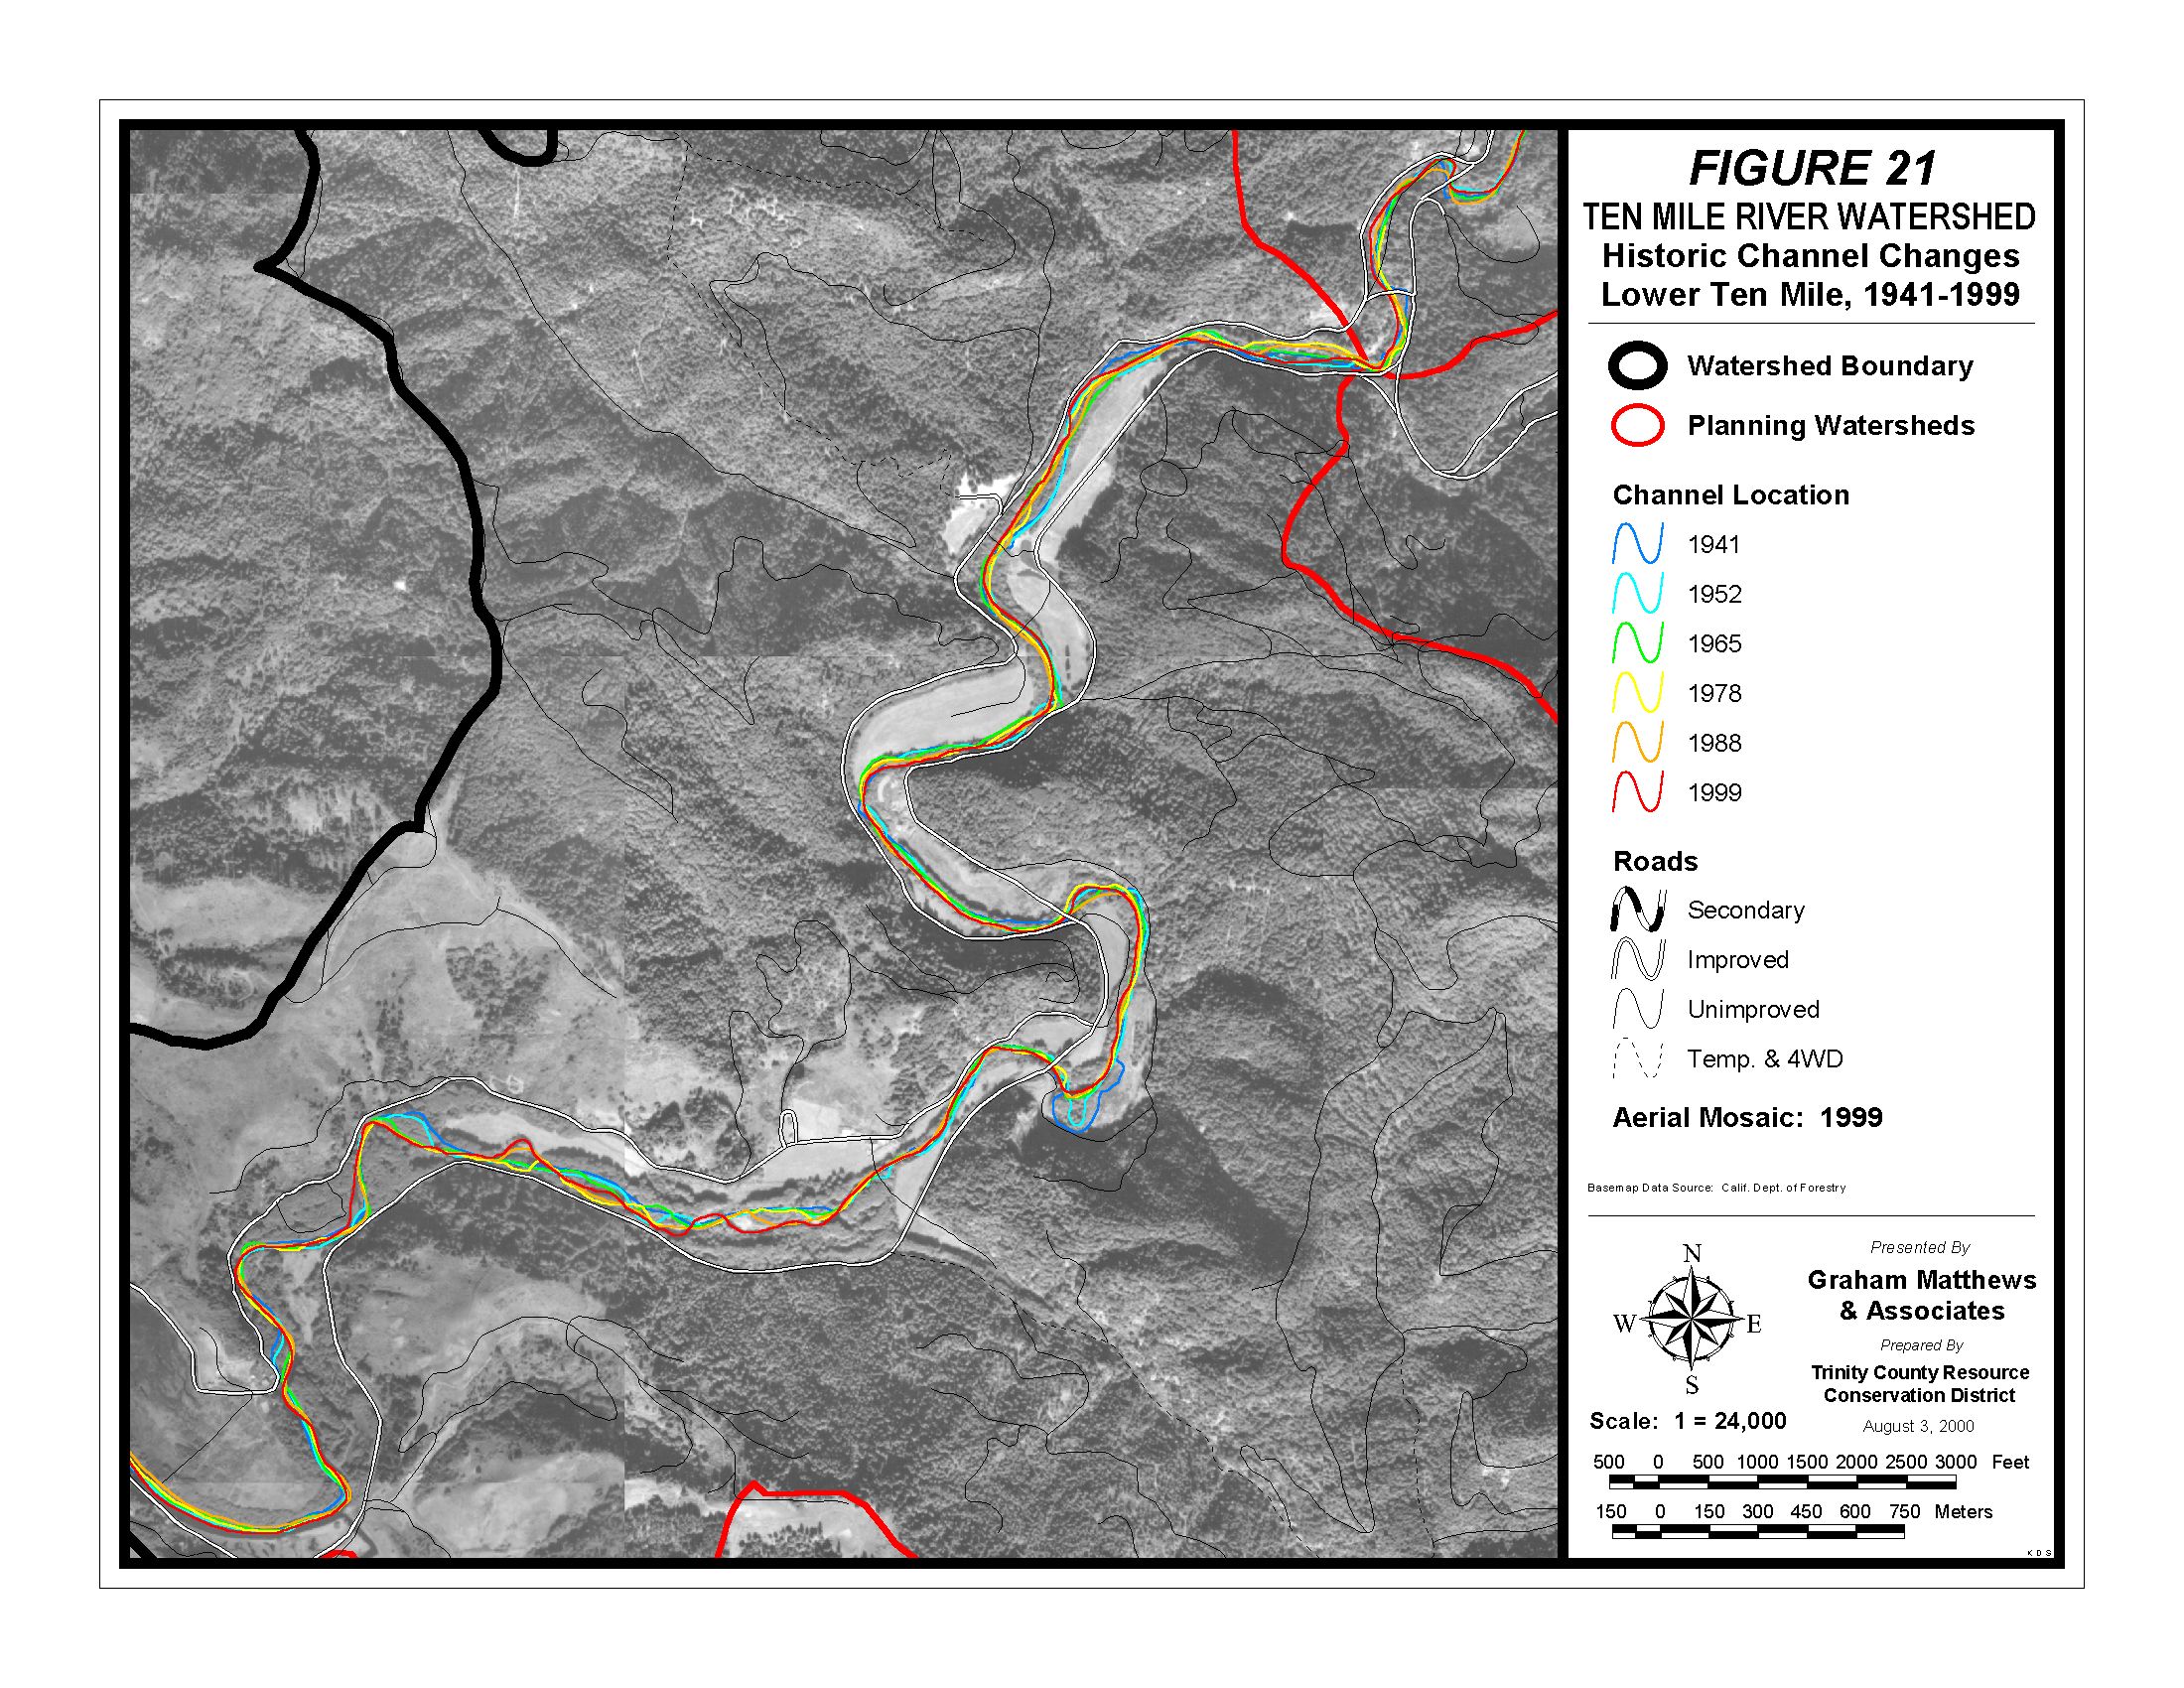
Figure 21 from Matthews (2000) shows the meander pattern of the lower Ten Mile River from 1942 to 1999. The river channel seems to have been most profoundly changed by the 1964 flood. Rivers can braid and meander causing bank erosion in agricultural areas in response to high sediment transport.
Figure 25 from Matthews (2000) compares a location on the lower Ten Mile where it is joined by the South Fork in 1941 and 1999.
The landslide map from Matthews (2000) shows huge areas which slide in the North Fork and Middle Fork as a result of the 1964 flood. While landslides in north central sub-basins were likely triggered by logging, much of the upper North and Middle Forks extend into Central Belt Franciscan terrain which had a high natural failure rate in this event.
Before roads were used for logging the Ten Mile River, railroads followed the South Fork and extended up the lower North and Middle Forks. Figure 29 from Matthews (2000).
 Click on image to enlarge (730K).
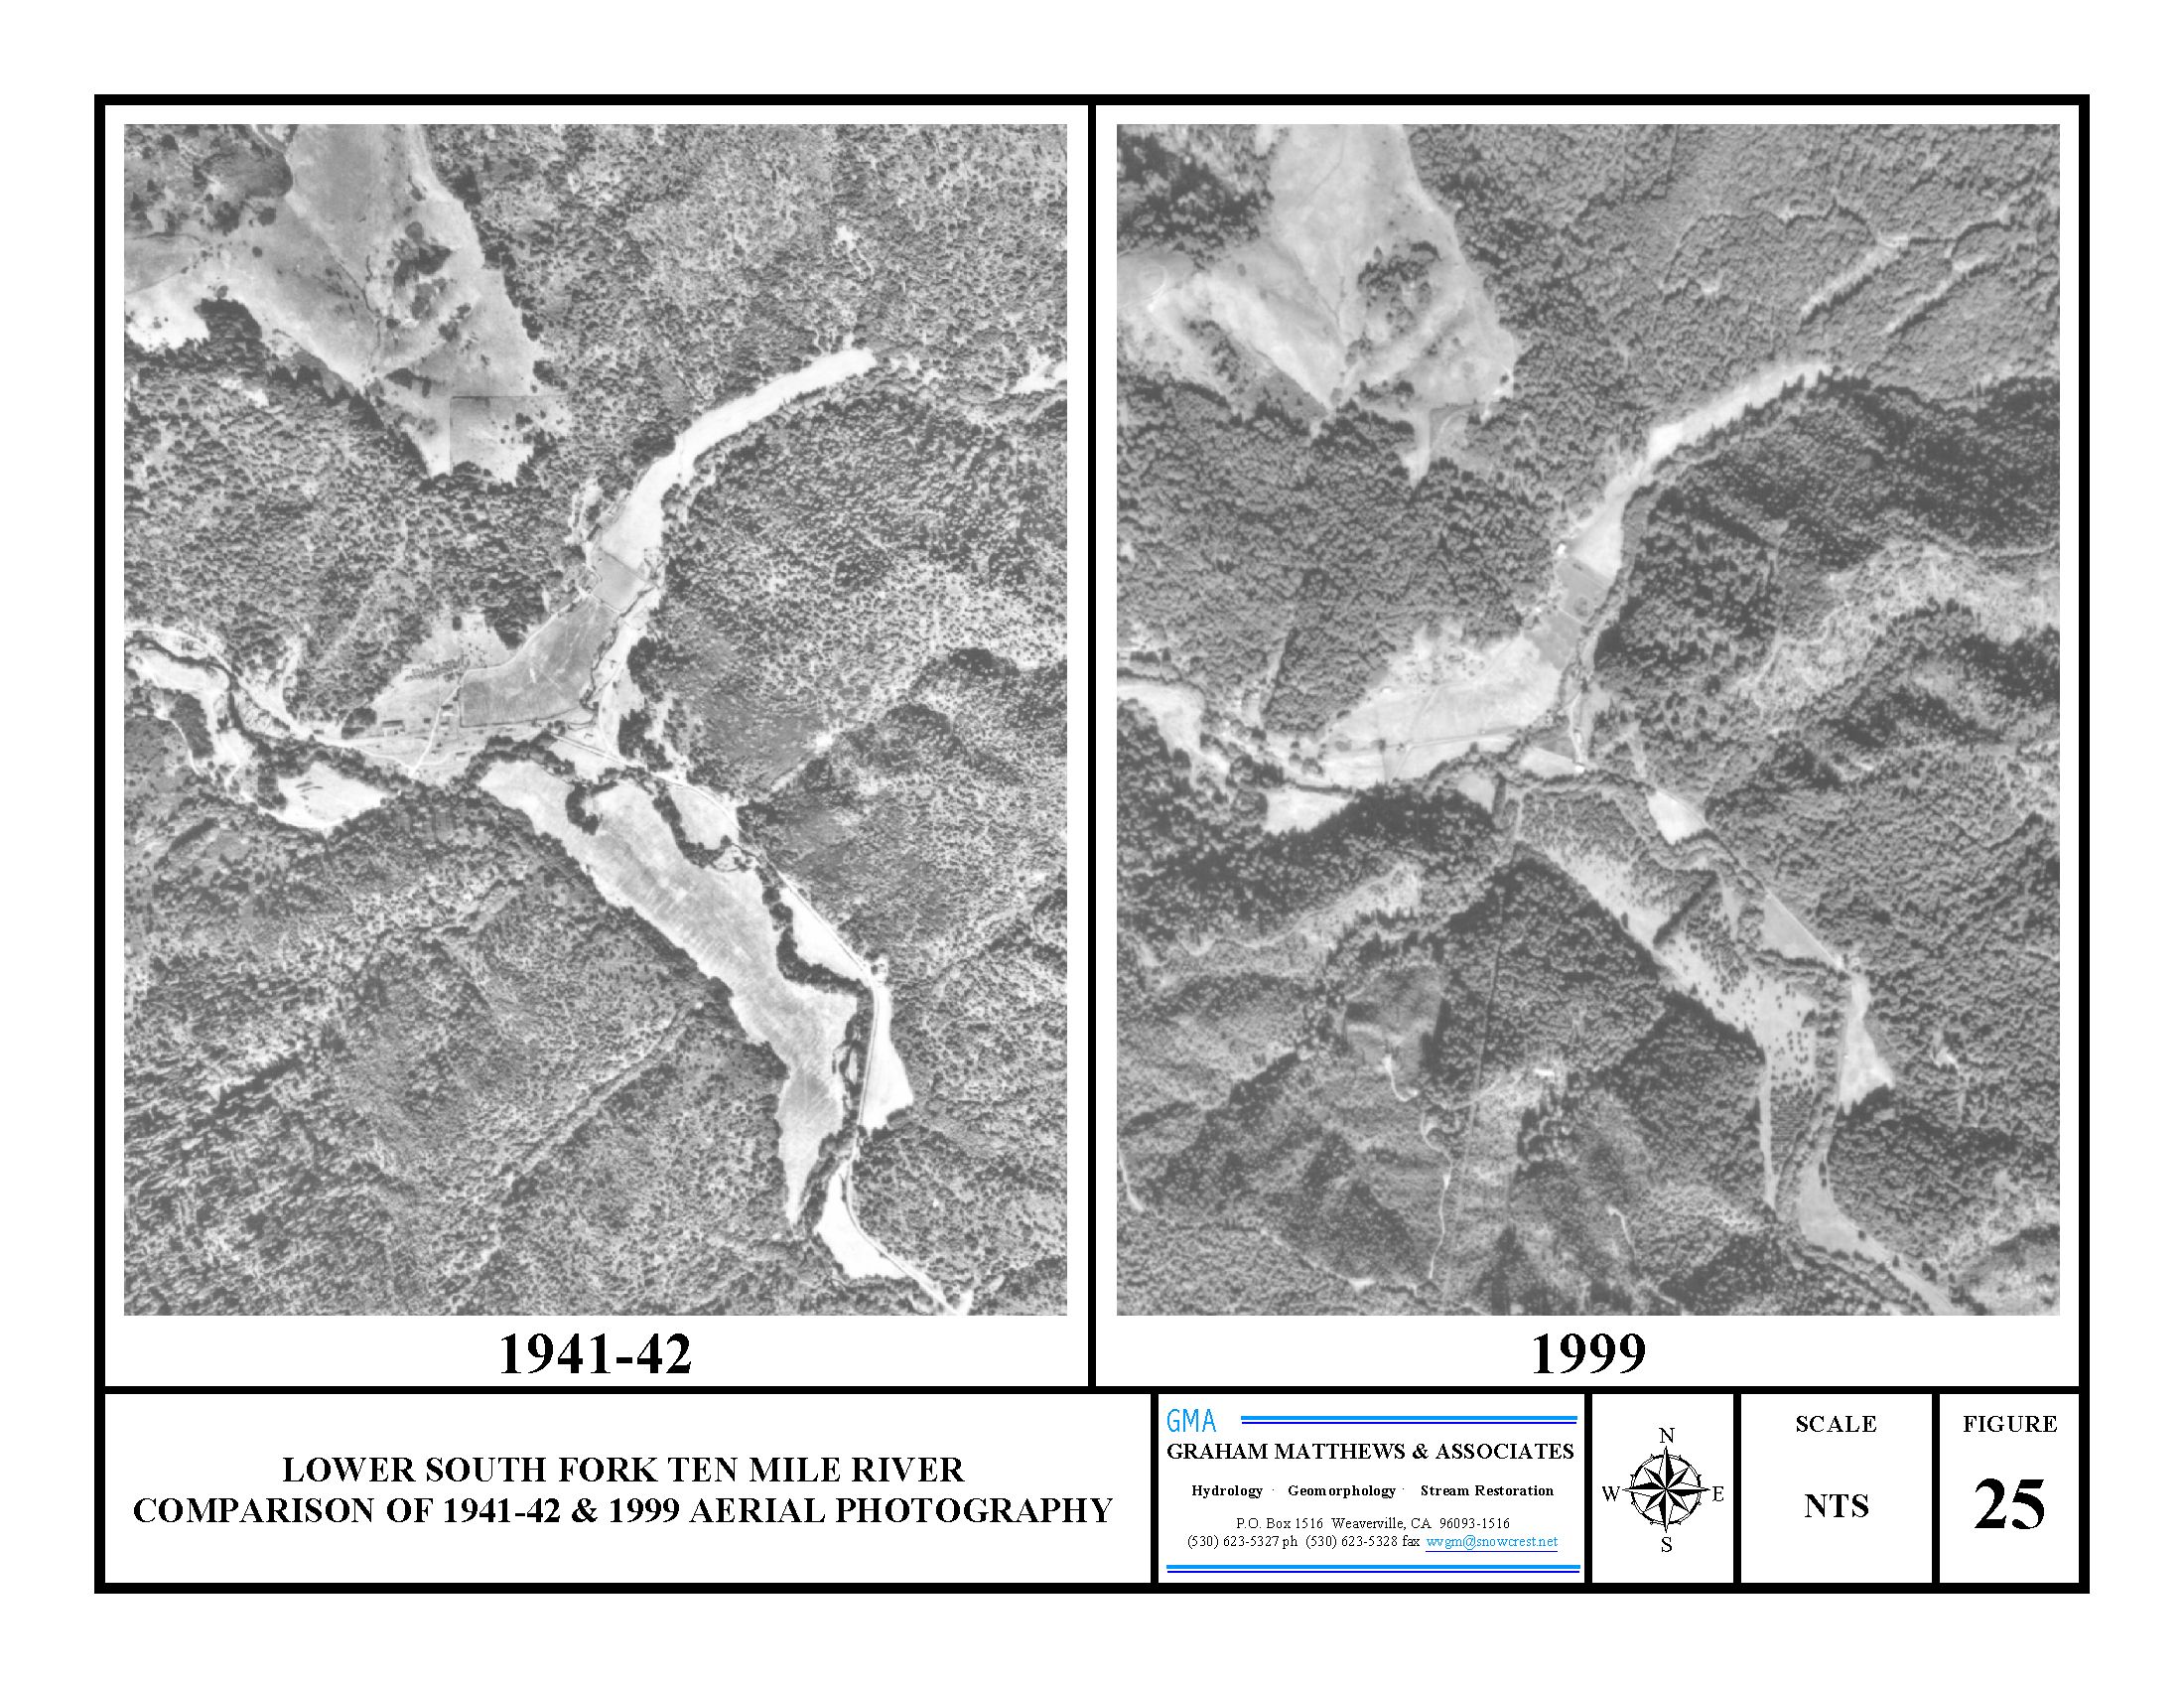 Click on image to enlarge (629K).
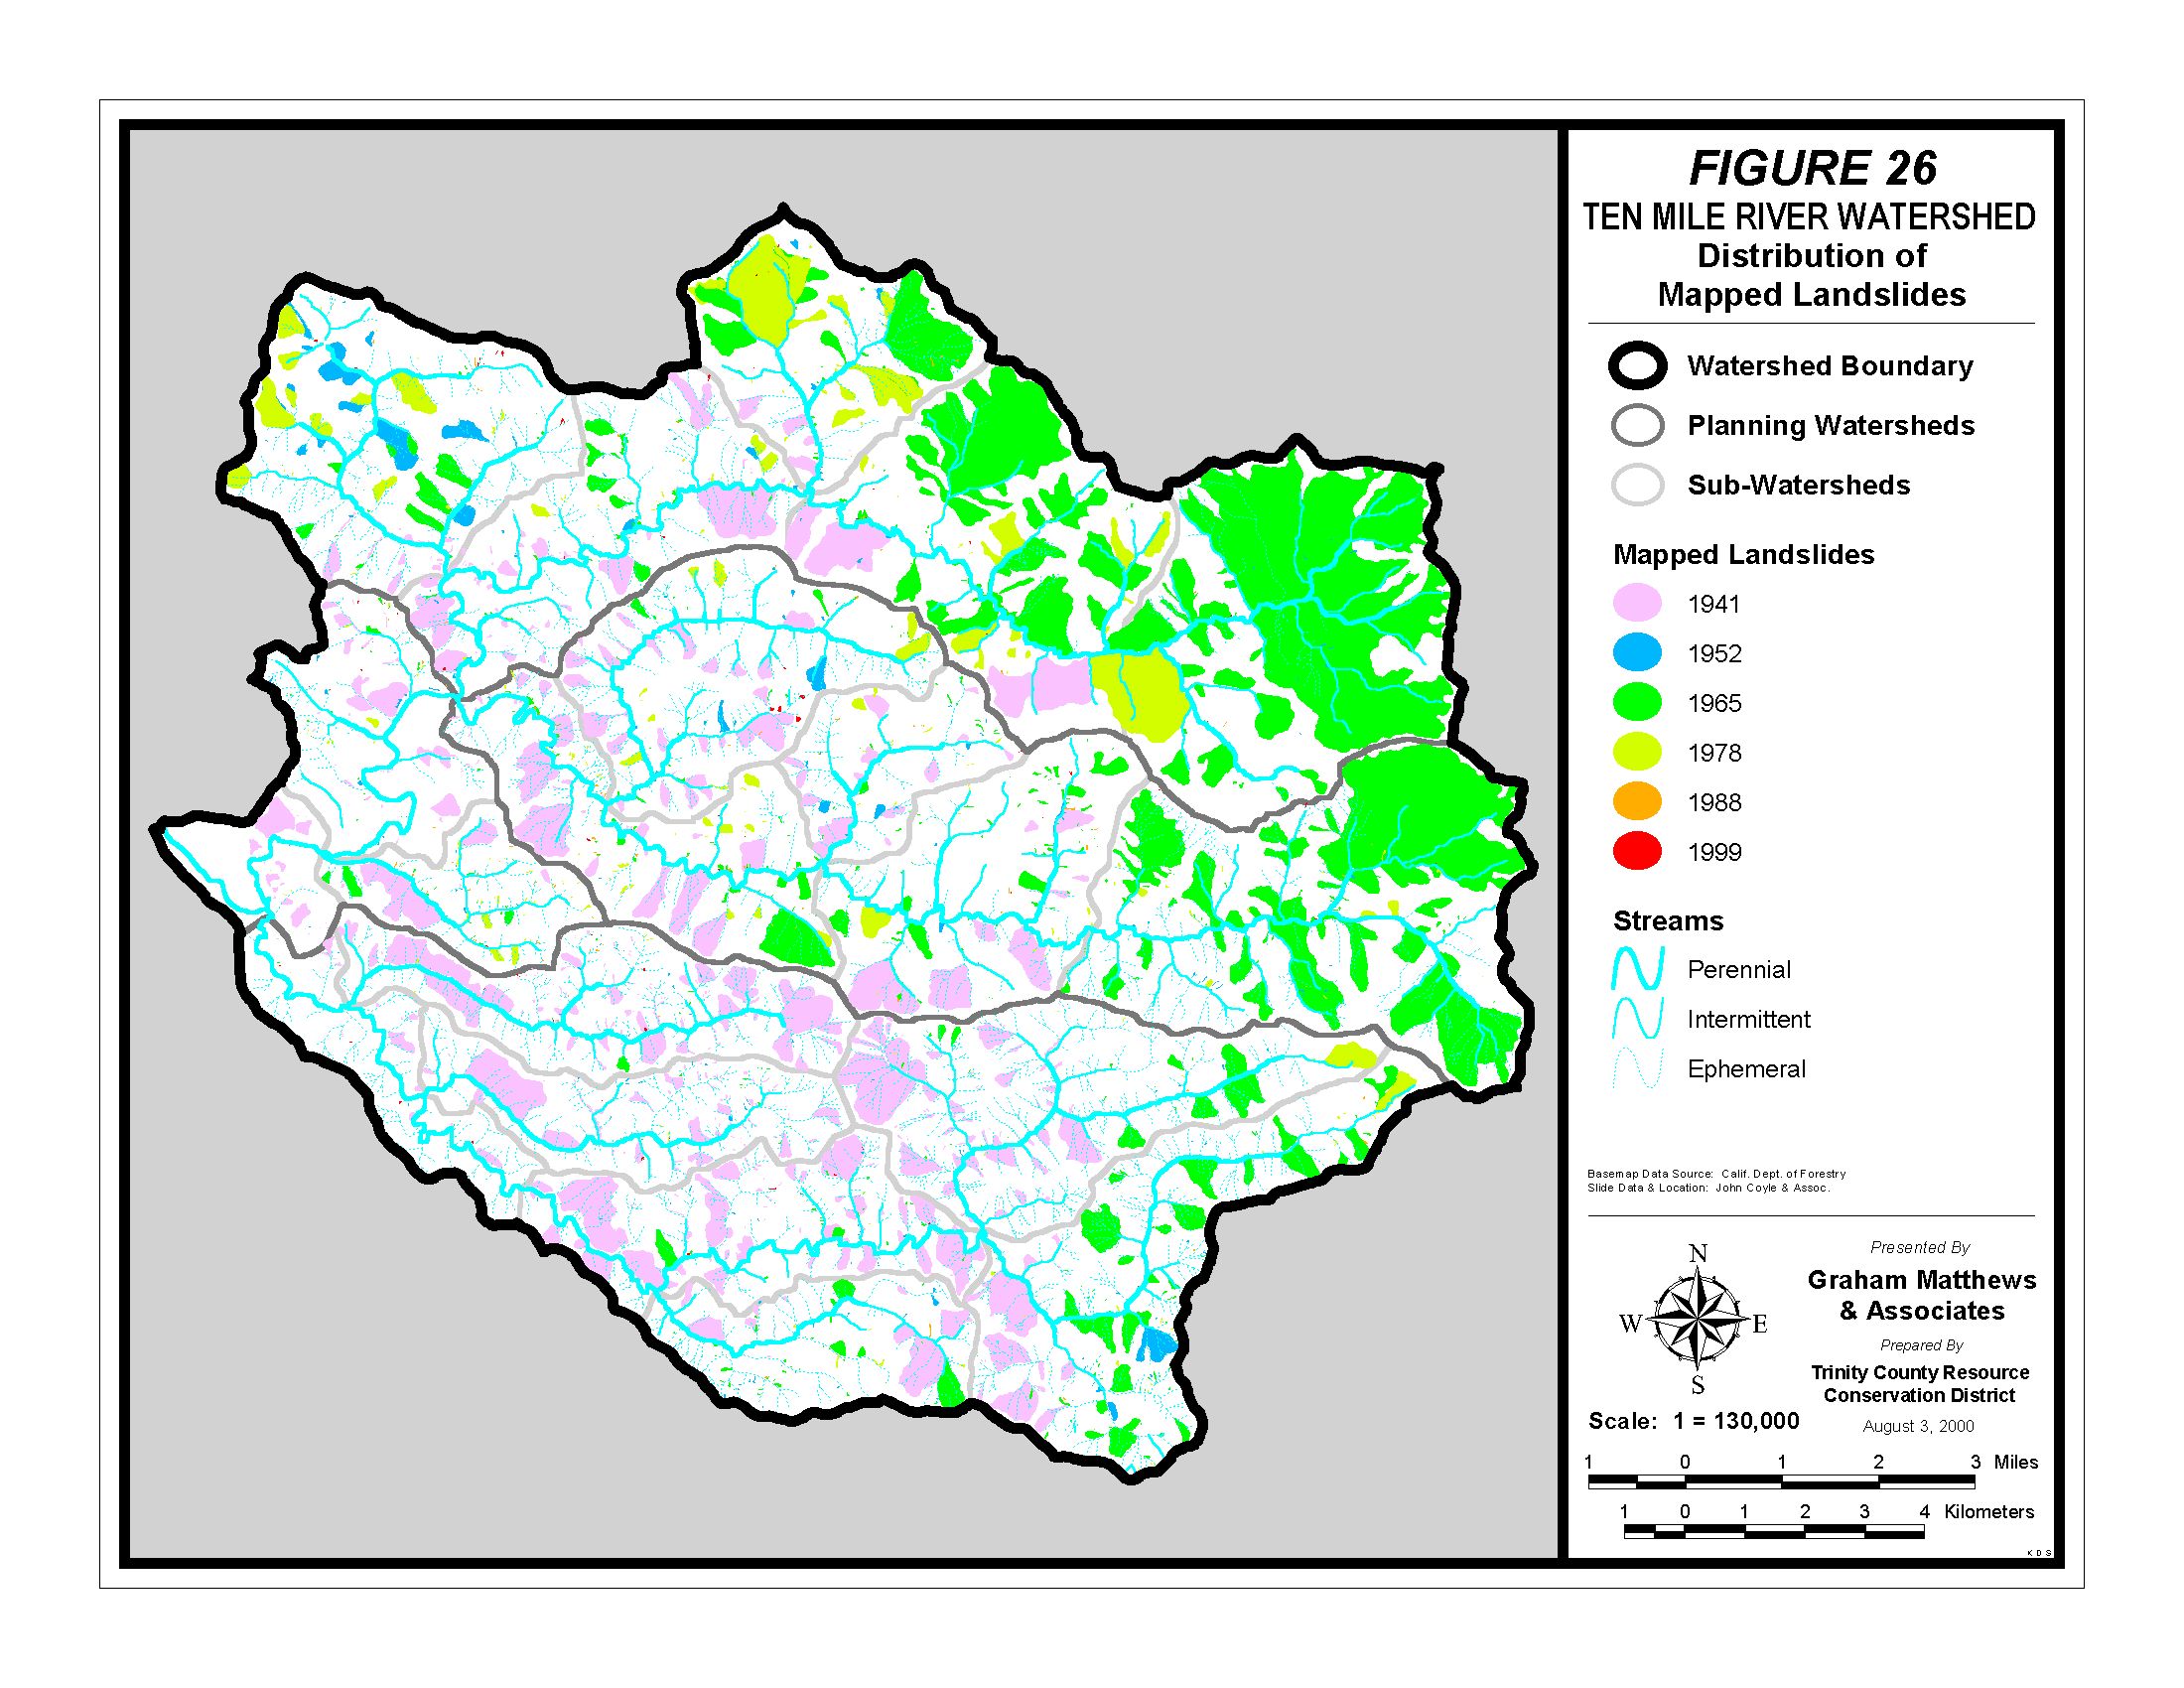 Click on image to enlarge (568K).
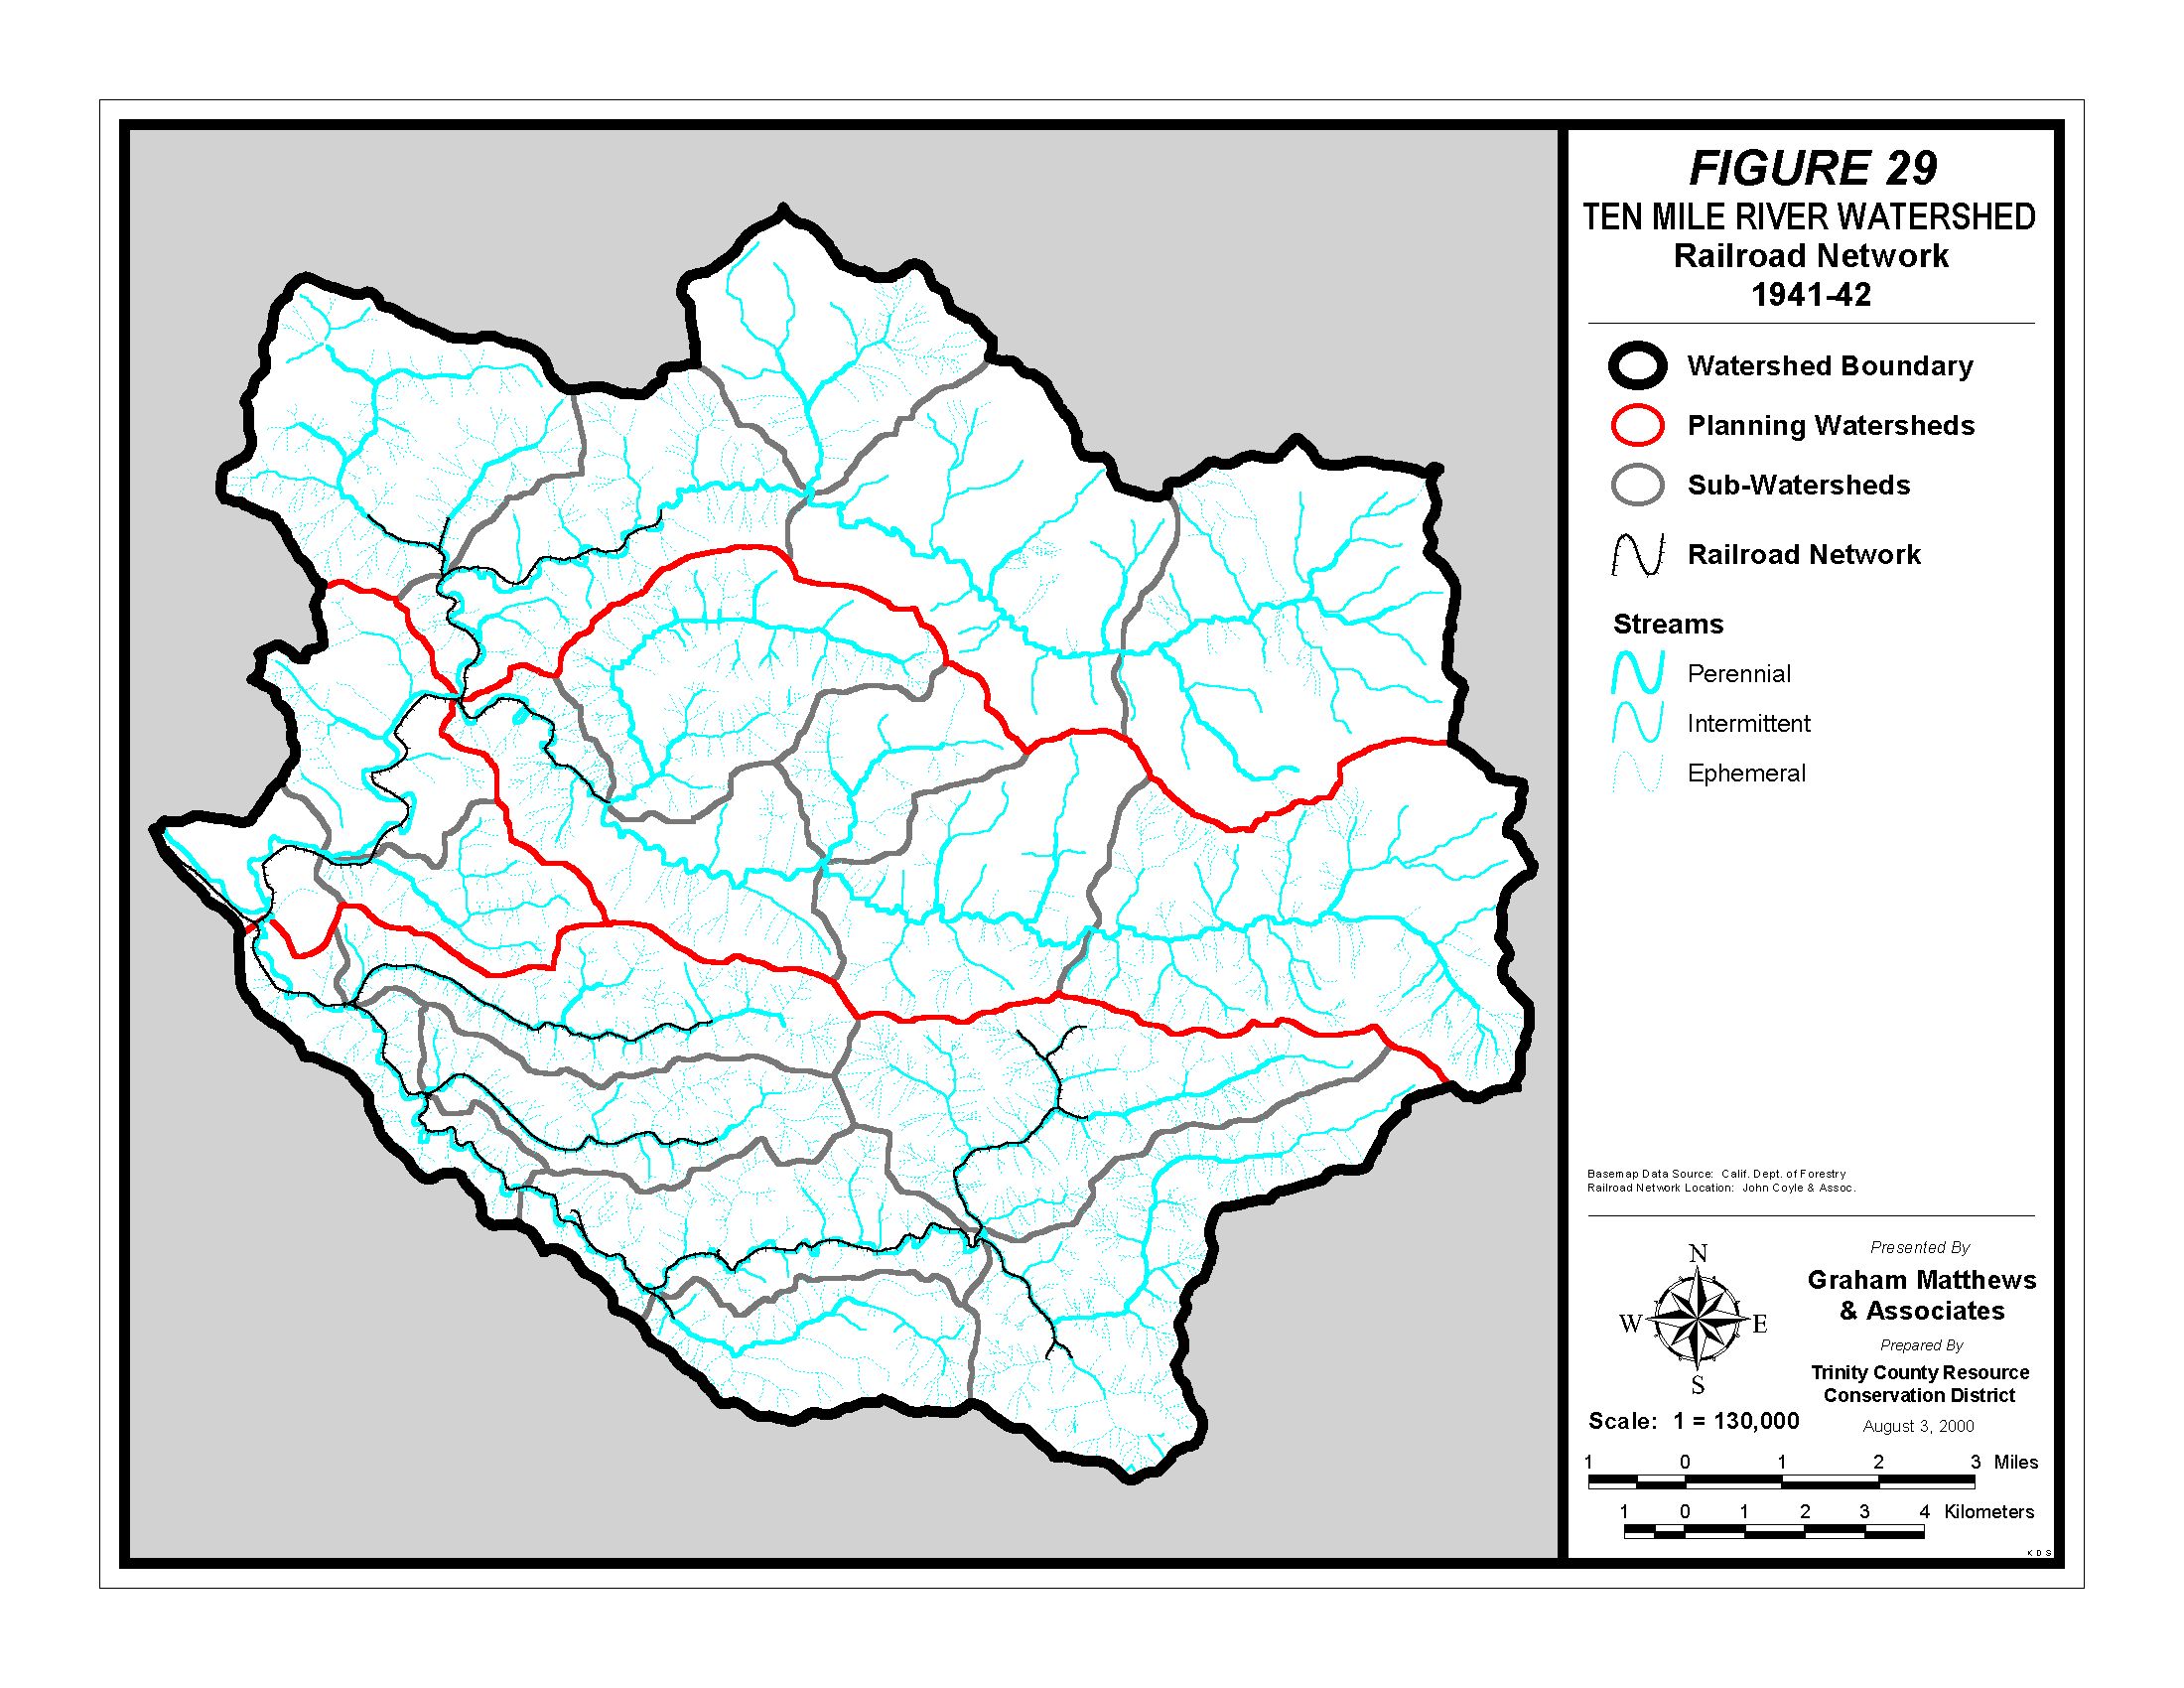 Click on image to enlarge (525K).
To learn more about this topic click here
| www.krisweb.com |