
| Area | Lower Ten Mile |
| Topic | Lower Ten Mile Basin Maps |
The image above is from the KRIS Ten Mile Map project and shows the elevation of the Ten Mile watershed and sub-basins as they appear in the KRIS database. The Lower Ten Mile basin has low relief in the west with estuarine habitat, dunes and agricultural land. The headwaters of Mill Creek in the southeastern part of the watershed rises sharply to over 350 meters or over 1,100 feet in elevation.
The image above is from the KRIS Ten Mile Map project and shows stream gradient. While the Ten Mile River itself is very low gradient (<1%), smaller tributaries and the headwaters of Mill Creek are very high gradient. Of tributaries in the Lower Ten Mile basin, only the lowest reaches of Mill Creek are suitable for coho spawning and rearing.
The image above is from the KRIS Ten Mile Map project and shows slopes over 45% on a gray scale hillshade backdrop. The eastern part of the Lower Ten Mile sub-basin has some areas of very high relief which may be associated with increased landslide risk.
The image above is from the KRIS Ten Mile Map project and shows timber harvests approved between 1990 and 2000. The Mill Creek watershed in the Lower Ten Mile sub-basin experienced the highest rate of timber harvest in this period. THP data provided by the California Department of Forestry.
The image above is from the KRIS Ten Mile Map project and shows vegetation as interpreted from a 1994 Landsat image by the U.S> Forest Service Remote Sensing Lab. The Lower Ten Mile sub-basin has non-forest conditions in the west as a result of dunes, the estuary and farm lands. Small-medium (12-19.9" diameter) and small trees (5-11.9") predominate in forested areas but large patches of medium-large trees (20-29.9") occur in Mill Creek.
The image above is Figure 21 from Matthews (2000) and shows the meander pattern of the Lower Ten Mile River over different periods.
The image above is part of an aerial mosaic assembled in ArcView by Matthews (2000) and assimilated for use in the KRIS Map project. The mouth of the Ten Mile River is at upper left, while the South Fork joins the main stem and lower center. Large dunes south of the mouth extend almost to the City of Ft Bragg. Grasslands and pasture give way to forests in the east (at right).
 Click on image to enlarge (259K).
 Click on image to enlarge (61K).
 Click on image to enlarge (153K).
 Click on image to enlarge (215K).
 Click on image to enlarge (97K).
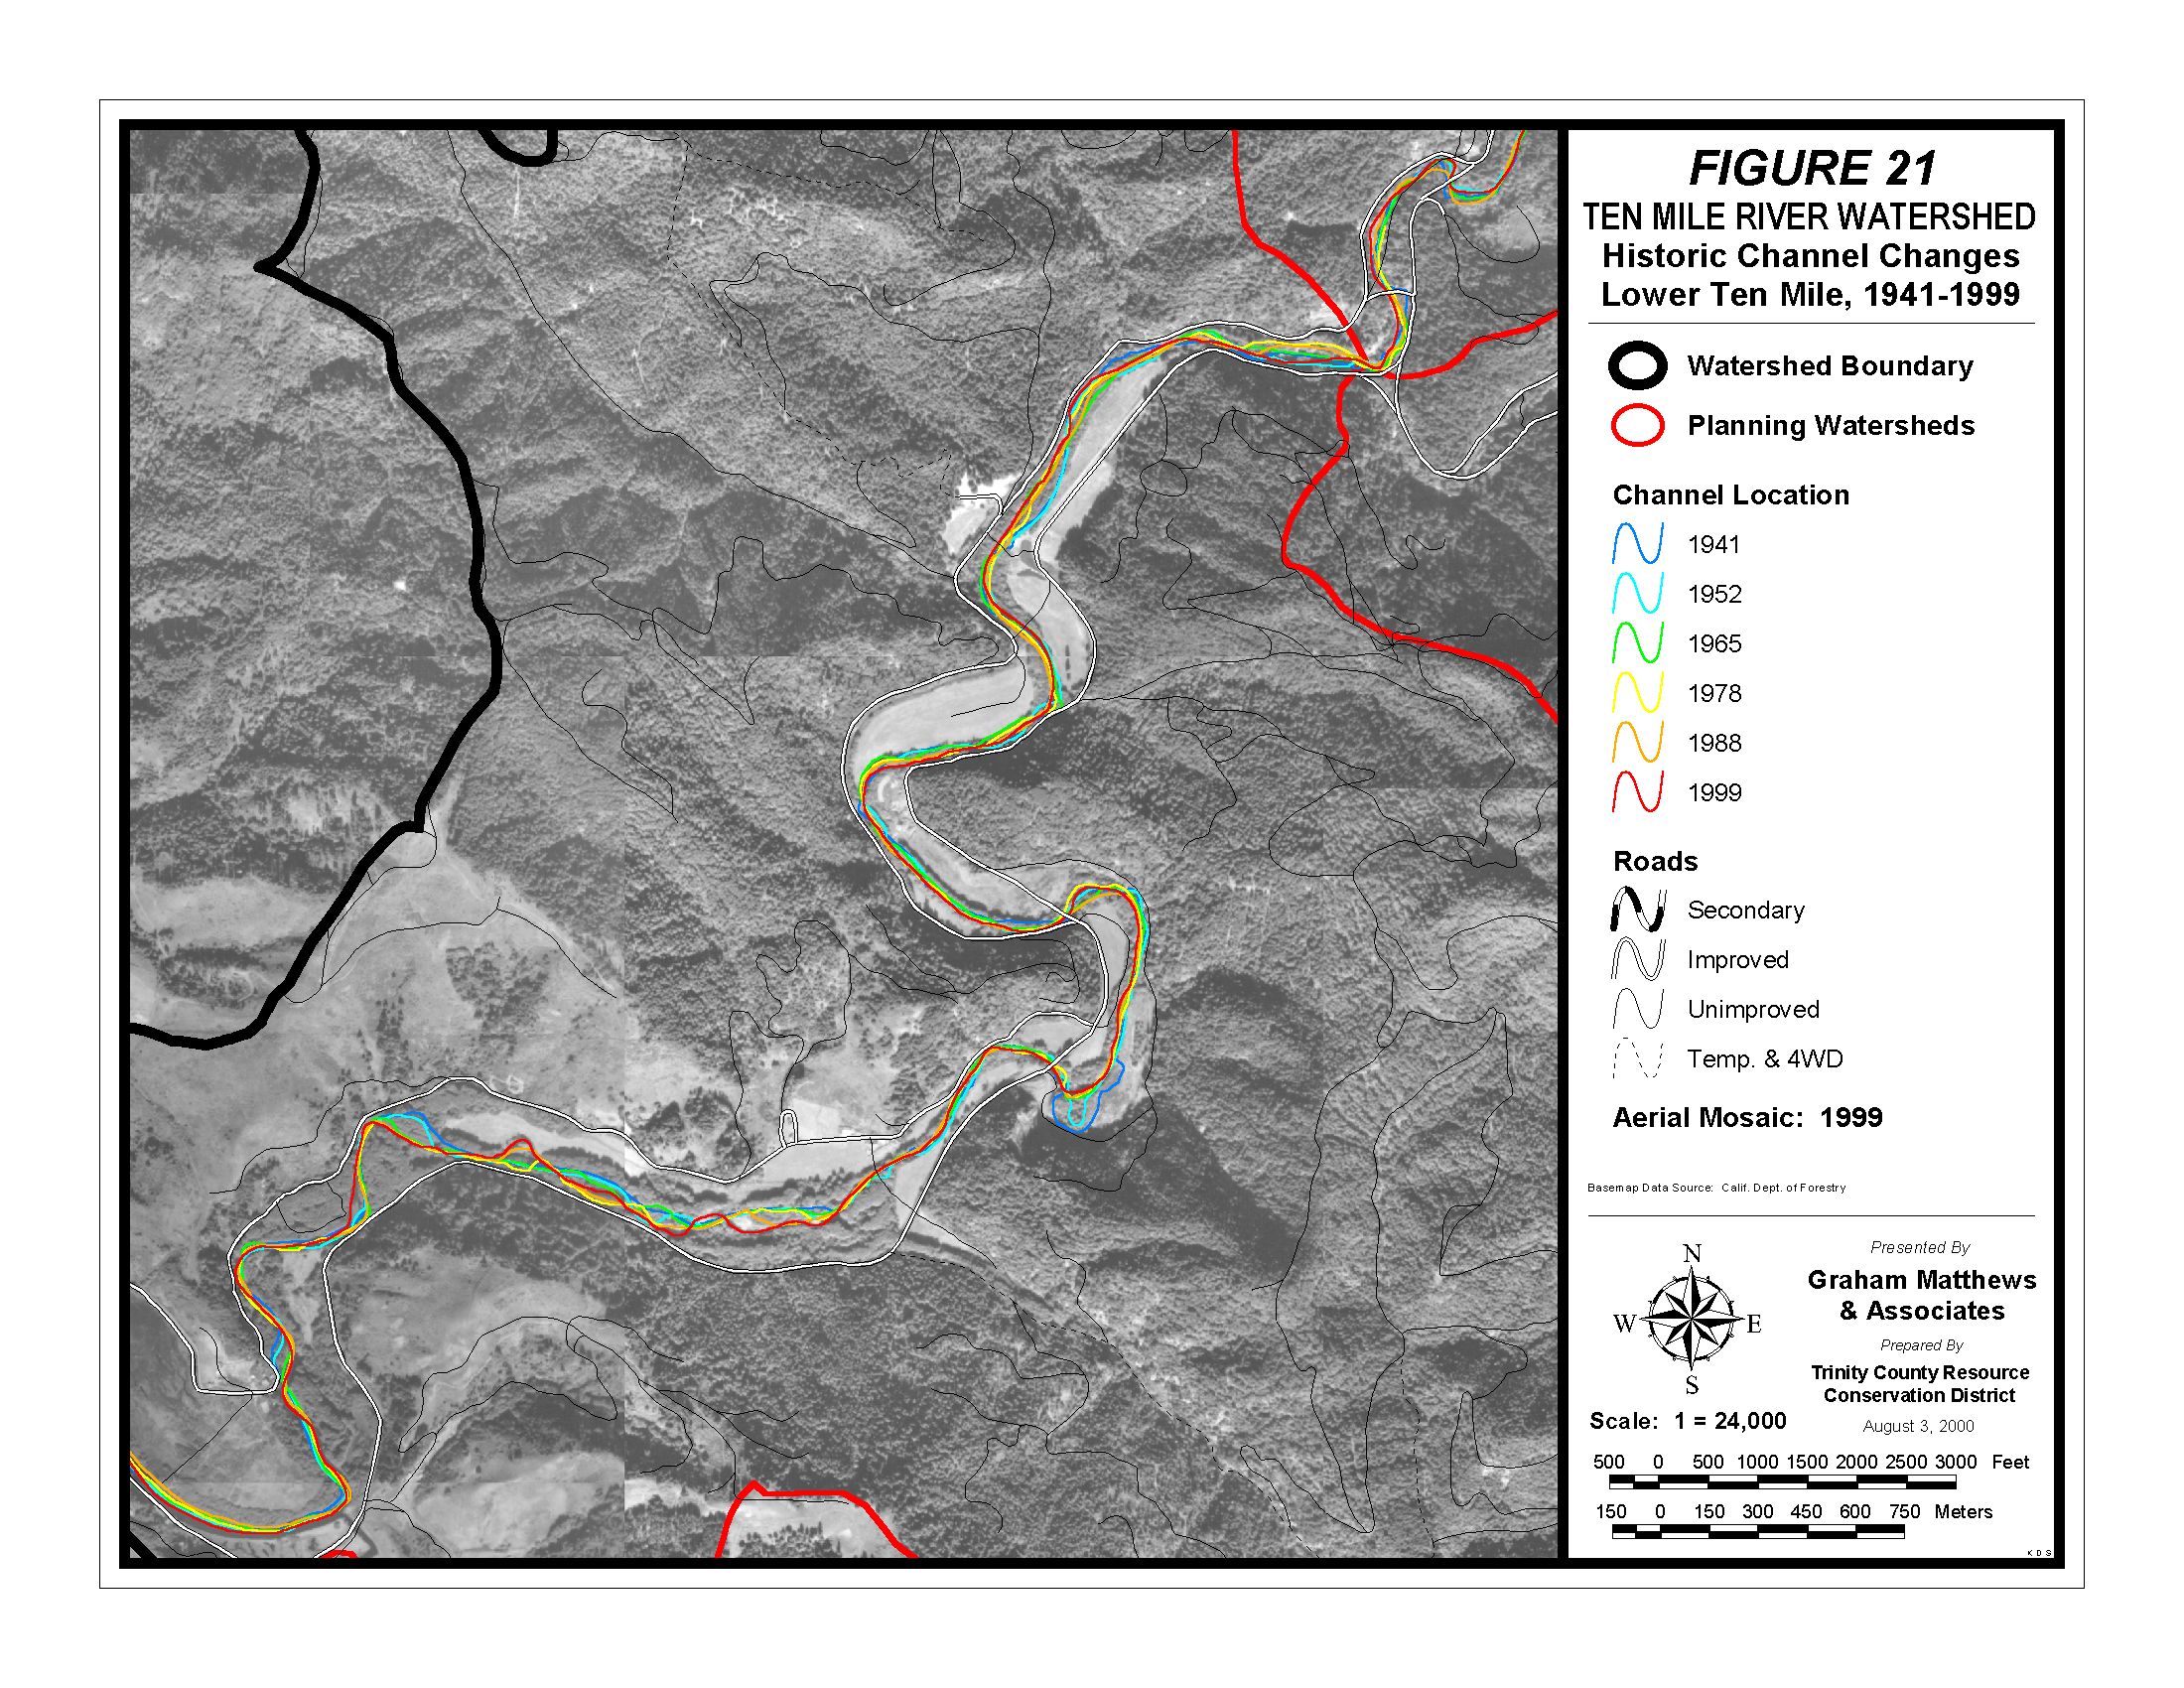 Click on image to enlarge (730K).
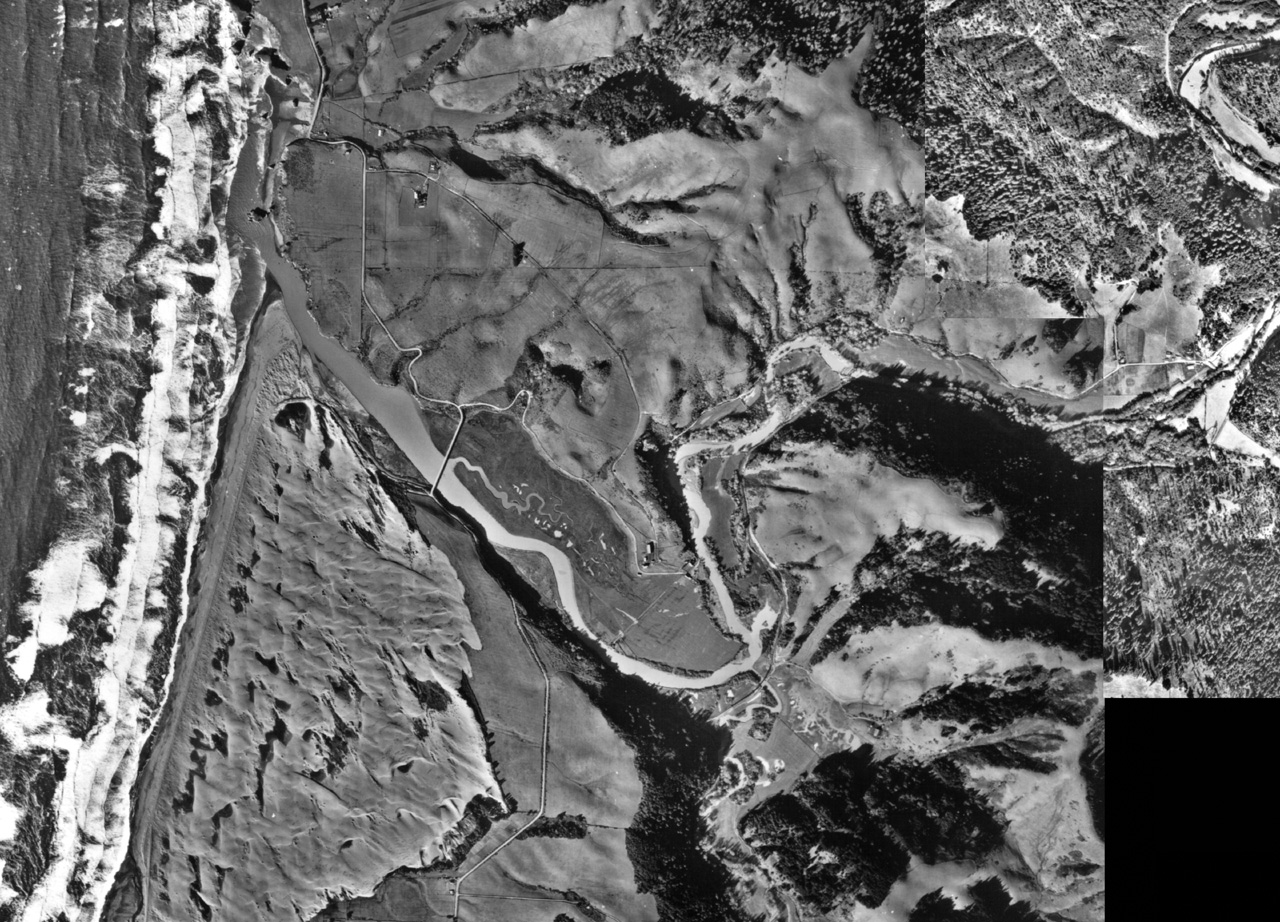 Click on image to enlarge (535K).
To learn more about this topic click here
| www.krisweb.com |