| Area | Middle Fork Ten Mile |
| Topic | Habitat: Pool Frequency, Middle Fork and Tributaries |
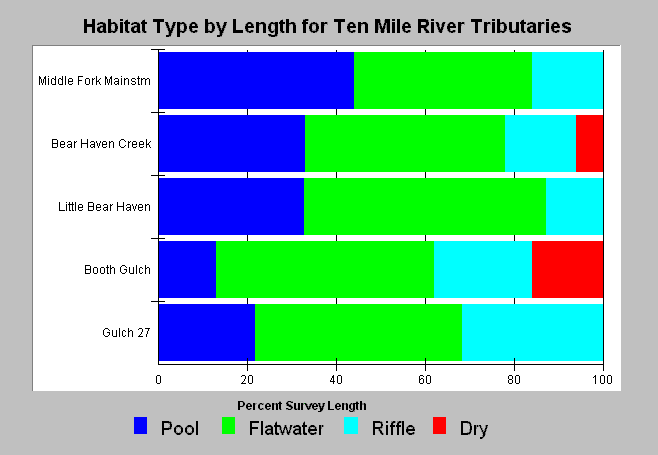
| Caption: The above chart reflects pool habitat availability, or the proportion of surveyed lengths of Middle Fork Ten Mile River tributaries occurring as pool habitat. The chart also illustrates the percentage of linear habitat that had gone subsurface (red bars) during the time of survey which varied from June to August. This variability would affect the percent riffle habitat. According to CDFG benchmarks for percent pool habitat, no tributaries of the Middle Fork Ten Mile River provide good salmonid habitat (>50%). Streams are sorted by basin area. See Info Links for more information. | |
 |
To learn more about this topic click here .
To view the table with the chart's data, click Chart Table web page.
To download the table with the chart's data, click hab_cft_wq.dbf (size 3,353 bytes) .
To see meta information about the data table used for this topic click here
| www.krisweb.com |
