
| Area | North Fork Ten Mile |
| Topic | North Fork Ten Mile River Basin Maps |
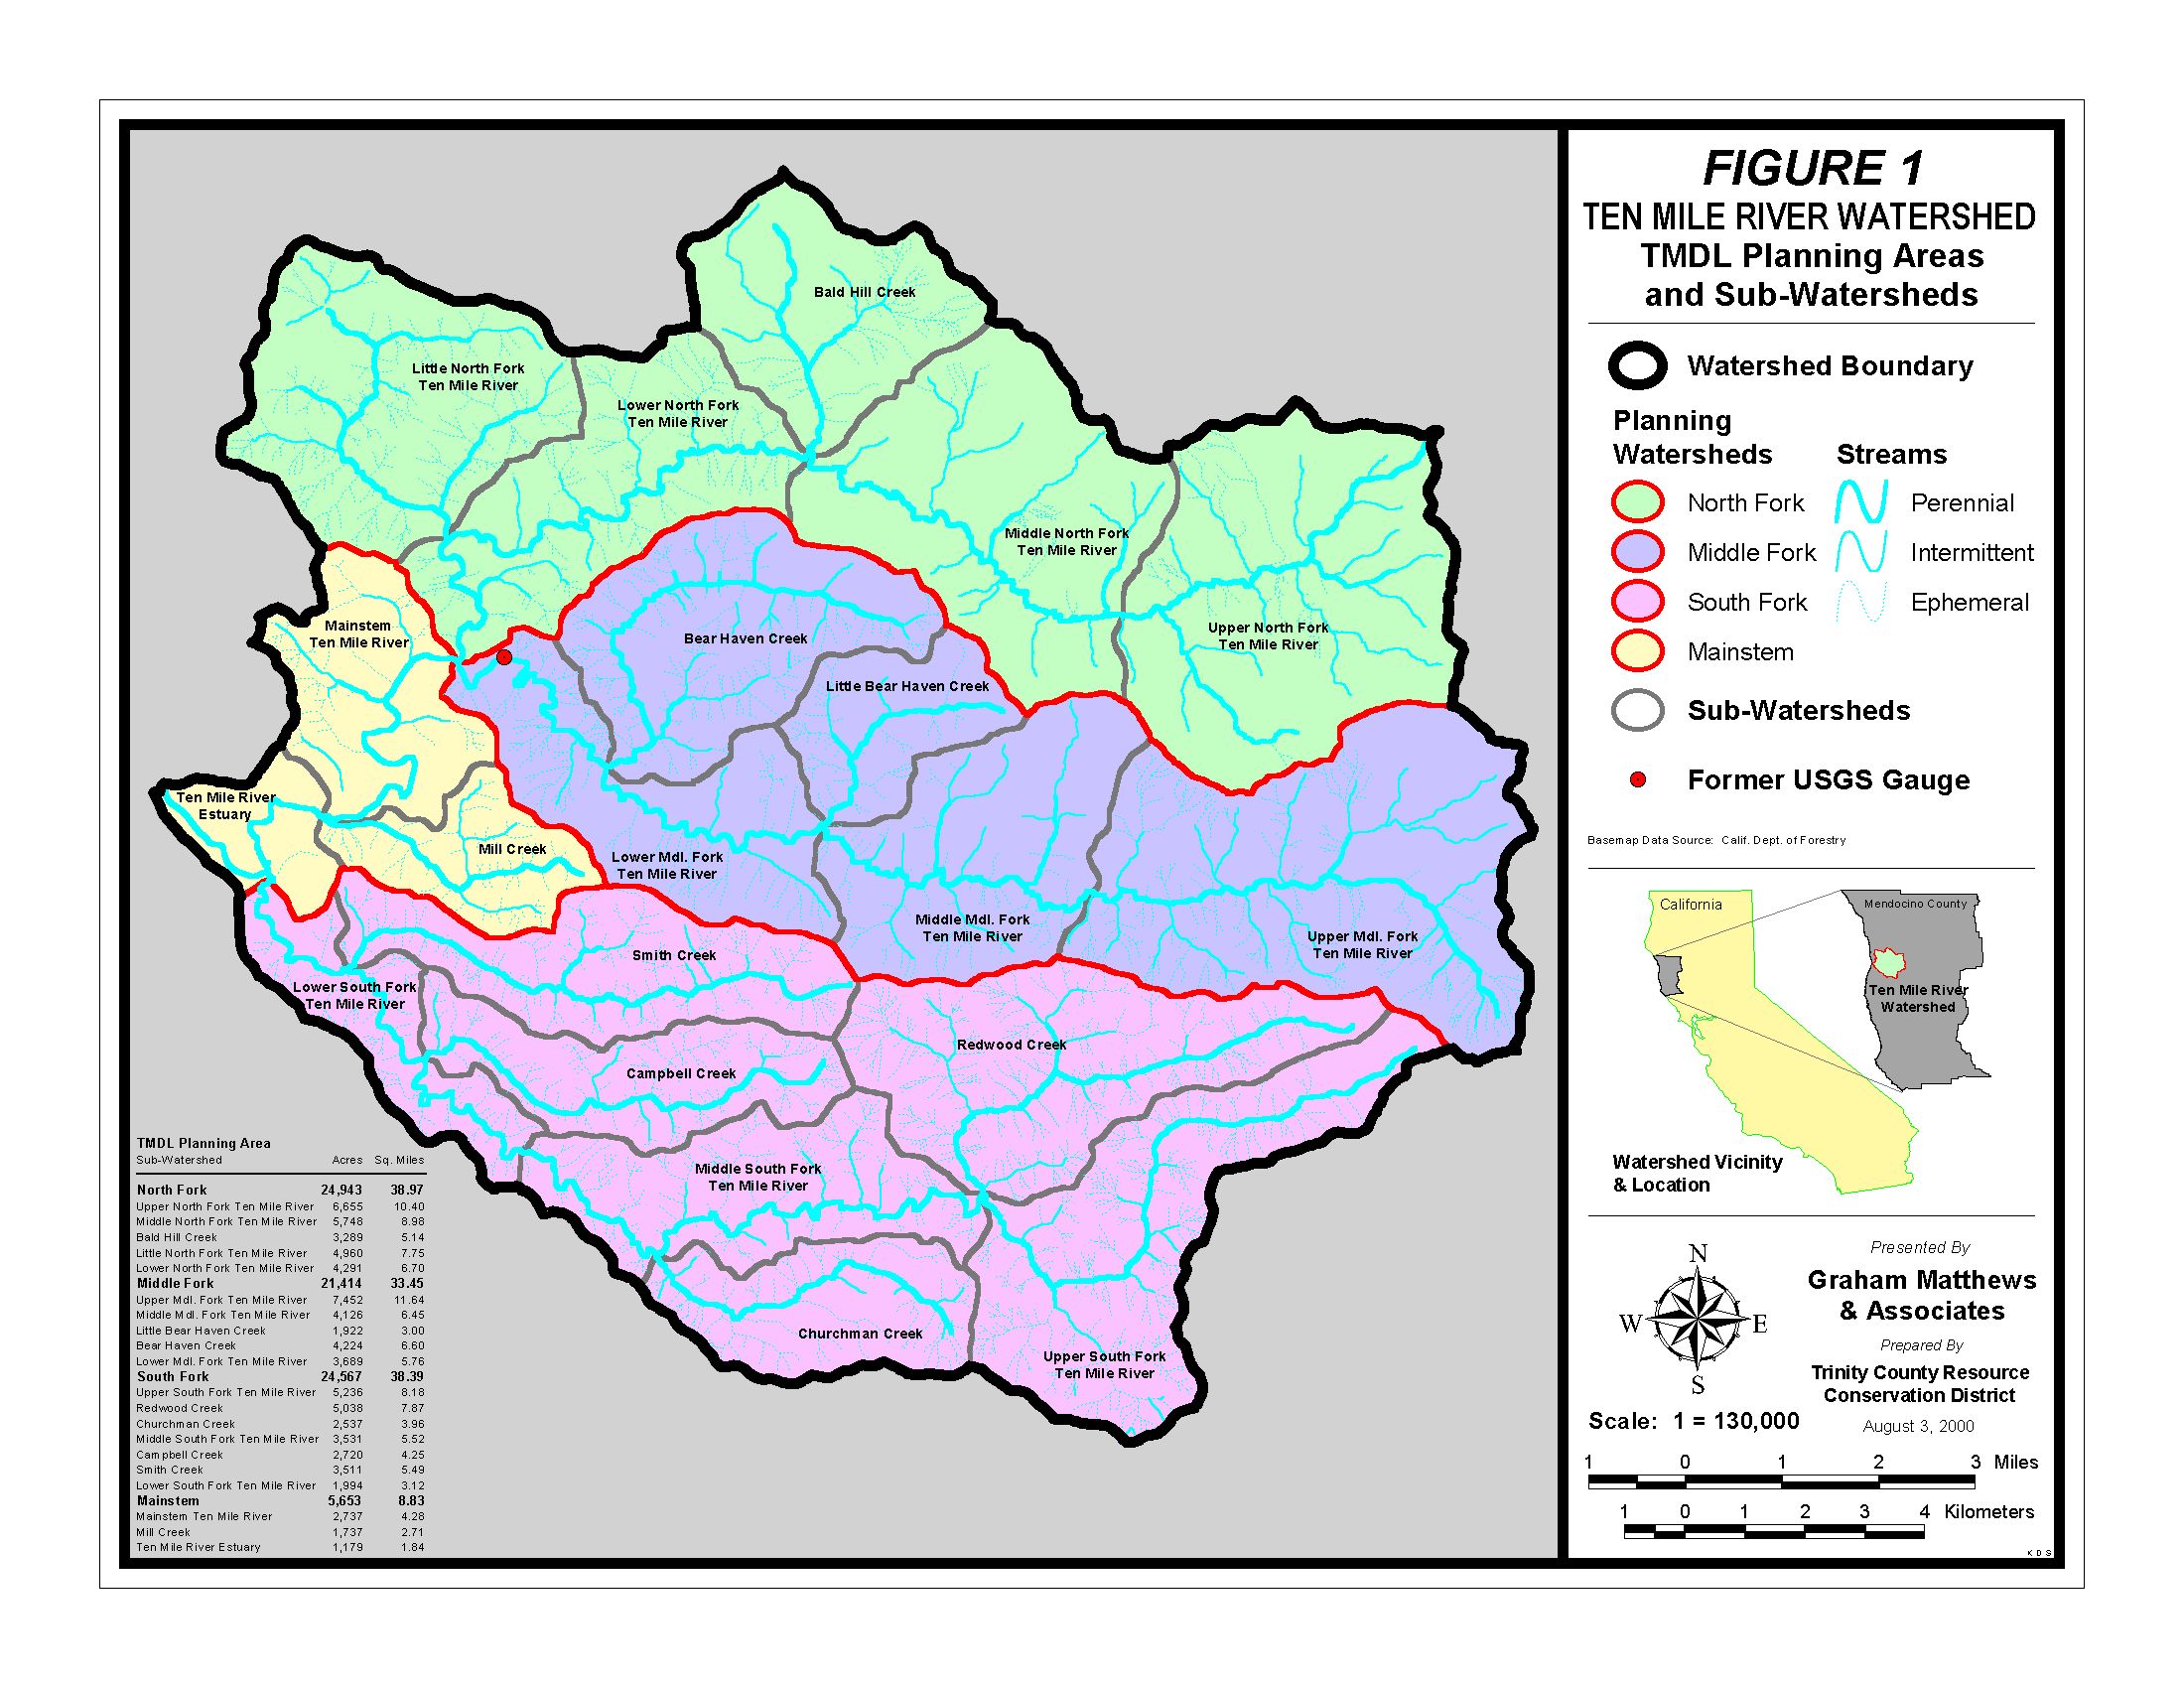
The map above taken from Matthews (2000) shows the North Fork sub-basin of the Ten Mile River in light green, which is the same geographic area used for the KRIS database.
This colored relief map from the KRIS Ten Mile Map project includes the North Fork Calwater basins: Little North Fork, Bald Hill Creek, Vickanne and Patsy Creek. Relief in the Patsy Creek area is due to large earthflows resulting from Central Belt Franciscan bedrock which underlies it.
The percent slope for the North Fork Ten Mile River basin is shown above on a backdrop of a gray scale shaded relief model. High slope steepness shows in the Little North Fork and Bald Hill Creek Calwaters. Taken from the KRIS Ten Mile Map project. Much of the Patsy Creek watershed is in Central Belt Franciscan formation and is less steep as a result of continuous slumping.
This map shows timber harvest constructed from aerial photos from different periods constructed by Matthews and Associates (2001) with 1988-1999 timber harvests made transparent so earlier logging history could be viewed. From the KRIS Ten Mile Map project.
The image above comes from the KRIS Ten Mile Map project and shows timber harvests as mapped by the California Department of Forestry by silvicultural methods from 1990-2000 for the North Fork sub-basin. The timber harvests shown have been approved but may not have been implemented when the 1999 aerial photo (Picture #4) was taken.
The image above is from the EPA Land Cover project, which is included in the KRIS Ten Mile Map project and shows North Fork sub-basin areas. The most eastern portion of the watershed shows as grasslands, shrubland and mixed forest due to earthflow terrain in this region (see discussion in Geology Background pages). Patches of mixed forest and shrubland disbursed throughout the other Calwaters reflect early seral conditions after timber harvest.
 Click on image to enlarge (554K).
 Click on image to enlarge (379K).
 Click on image to enlarge (260K).
 Click on image to enlarge (190K).
 Click on image to enlarge (342K).
 Click on image to enlarge (115K).
To learn more about this topic click here
| www.krisweb.com |