| Area | Caspar Creek |
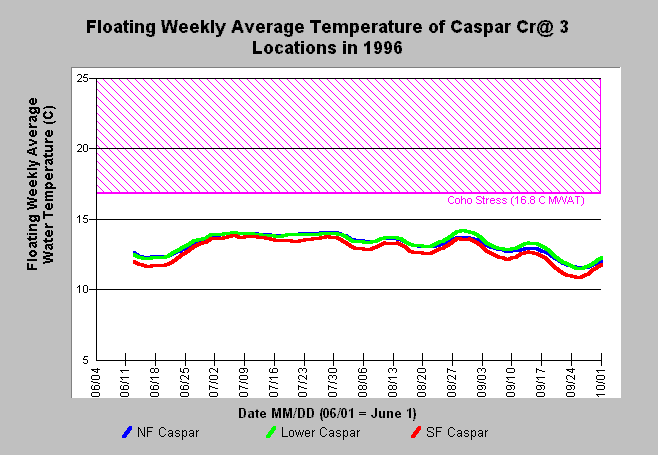
| Topic | Temperature: Floating Weekly Average of Caspar Cr @ 3 Sites 1996 |
| Caption: The floating weekly average temperature of Caspar Creek at three locations was within optimal temperature range for coho salmon juveniles in 1996. Lower Caspar (site 547) warmed slightly above temperatures measured in the North Fork (site 546) and South Fork (site 548). The 16.8 degree C stress threshold for coho salmon was chosen based on Welsh et al. (2001). Click on Info Links for more information. Click on Picture for a map of locations. Data provided by the Forest Science Project with the permission of Jackson Demonstration State Forest. | |
 |
To learn more about this topic click here .
To view the table with the chart's data, click Chart Table web page.
To download the table with the chart's data, click jdsf_tempsum.db (size 280,576 bytes) .
To see meta information about the data table used for this topic click here
To view the table with the chart's source data, click Source Table web page.
To download the table with the chart's source data, click jdsf_tempraw.dbf (size 2,556,027 bytes)
| www.krisweb.com |
