
| Area | Upper Big River |
| Topic | Sediment: Matthews Landslides by Land-Use Upper Basins 1921-2000 |
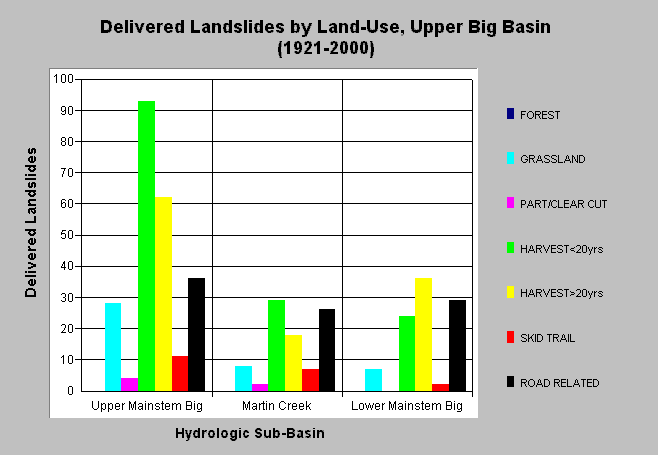
| Caption: The chart above shows the total number of delivered landslides per land-use area in the Upper Big River basin for the period 1921-2000. Estimates were generated from aerial photographs by Matthews and Associates (2001). Mass wasting is largely active in harvest areas and road fill. The Upper Mainstem Big River sub-basin shows the greatest activity in the Upper basin. See Info Links for more background information and links to references. | |
 |
To learn more about this topic click here .
To view the table with the chart's data, click Chart Table web page.
To download the table with the chart's data, click slides_type_ub.dbf (size 853 bytes) .
To see meta information about the data table used for this topic click here
To view the table with the chart's source data, click Source Table web page.
To download the table with the chart's source data, click slides_matt_type_allsubs.dbf (size 2,676 bytes)
| www.krisweb.com |