 |
 |
| Background | Hypotheses | Bibliography | Maps | Home |
| |
|
| Background | Hypotheses | Bibliography | Maps | Home |
KRIS Web Background Pages: Sediment
![]()
The California Geologic Survey has reservations regarding the content of KRIS Gualala (see comment note), particularly sediment source investigations under the TMDL, and CSG endorsement of the contents of this page is not implied.
![]()
Sediment data is included in KRIS Gualala because sediment is recognized as a limiting factor for aquatic resources in the Gualala basin, particularly cold water fish species such as steelhead and coho salmon (CRWQCB, 2001). Sediment data include median particle size distribution (D50), McNeil samples and V-Star, which measures sediment in pools. The source of the D50 and McNeil data is Gualala Redwoods Inc. Knopp (1993) studied the relationship of watershed disturbance and sediment in streams and his work includes two stations in the Gualala River watershed, Fuller Creek and Grasshopper Creek. Henry Alden of Gualala Redwoods, Inc. has suggested that median particle sizes in GRI streams are not significantly different from those in less disturbed watersheds (see note), although two watersheds offered as controls have nearly 40% timber harvest. The NCWAP Gualala team had reservations about the use of D50 due to stream gradient (see NCWAP note). That position is hypothetical and KRIS has stayed with Knopp (1993) interpretations until further field work in the Gualala is conducted.
The North Coast Regional Water Quality Control Board (NCRWQCB) staff have been engaged in a sediment source analysis of the Gualala River watershed pursuant to the Clean Water Act TMDL process (CRWQCB, 2001). The data from their technical support document (TSD) is used in KRIS Gualala as the best available estimate for understanding current sediment sources (see quote). The California Geologic Survey (CGS) mapped landslides as part of the Gualala Watershed Synthesis Report, but didn't identify sediment sources (CA RA, In Review). Their reservations regarding the TSD are related to large landslide contributions and their importance as well as other concerns (Sterling, 2002).
Thresholds are used on charts to show relative health of streams and suitability for salmonids. They are similar to those advanced for the Garcia River (US EPA, 1998), Ten Mile River (US EPA, 2000) and Big River (in press) TMDL studies. These targets are all explained and defended within the TMDL and can be viewed as a table below. The V* target is pools less than 21% filled with sediment, median particle size (D50) is to be greater than 37 mm in third order streams and McNeil samples less than 0.85 mm are to be less than 14%. These values appear reasonable given existing information both locally and regionally (see note on regional sediment standards for McNeil samples). The D50 target of 37mm is conservative in that this size clast is highly mobile and bedload movement can be extremely destructive to salmonid spawning success (Nawa and Frissell, 1990). Dietrich et al. (1989) showed that a decrease in median particle size distribution was indicative of recent contributions of sediment.
See Hypothesis #2 and #3 for more information on sediment as a limiting factor for salmonids in the Gualala River.
 |
At left
is Table 4, Water Quality Indicators
and Targets, from the Draft
Big River, Total Maximum Daily Load for Sediment (US EPA, in press).
KRIS Gualala uses these target values as thresholds on charts to indicate
whether values at a particular location indicate impairment.
|
 |
The
chart at left shows the median particle size distribution of the streambed
at several locations in the North Fork Gualala River basin between 1997
and 2001. Most values in the mainstem North Fork (NF), Little North Fork
(LNF), and Robinson Creek (RBC) are under the suggested TMDL range of 37
mm, which was intended to be applied to 3rd order streams. Little NF and
Robinson are 3rd order but mainstem North Fork is 5th order. Several stations
show considerable changes in median particle size distribution, suggesting
active bedload movement at those locations since 1997 (i.e. LNF #203 and
DRY #211). Bedload movement could be limiting coho spawning success because
of scour and fill on low recurrence interval storm events.
|
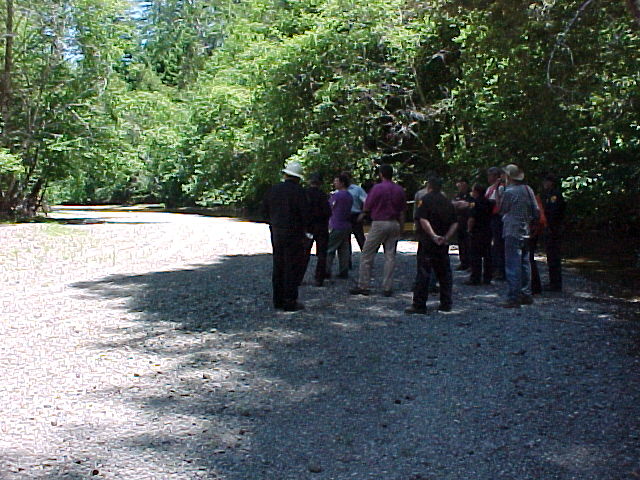 |
The
image at left shows a pre-timber harvest inspection tour of the North Fork
Gualala River looking upstream. Note that the channel is flat and wide with
the wetted area comprising only a thin ribbon at right under the alders.
This indicates major aggradation at this location from recent sources, which
also accounts for the small median particle size distribution of the stream
bed (Dietrich et al. (1989). Photo courtesy of Dave Hope, North Coast Regional
Water Quality Control Board.
|
 |
The
chart at left shows the median particle size distribution of the streambed
at several locations in lower Rockpile Creek. All values except the 1999
measurement at RP #221 CS3 are under the suggested TMDL range of 37 mm,
which was supposed to be applied to 3rd order streams. Rockpile Creek is
a 4th order stream, which should have larger particle sizes naturally as
a result of higher stream power. Station RP#221 CS3 showed an increase in
median particle size between 1998 and 1999. Small median particle size can
contribute to bedload mobility, which decreases salmonid spawning success.
Data provided by Gualala Redwoods Inc.
|
 |
The median
particle size distribution of the streambed at several locations in Buckeye
Creek. All values except the 2000 measurement at BC#223 CS2 is under the
suggested TMDL range of 37 mm. Buckeye Creek is a 4th order stream, while
the target was meant to applied to 3rd orders. The station BC#223 CS1 showed
an increase from 1997 to 2000. The small median particle size would favor
late spawning steelhead, which spawn after late spring storms when bedload
movement has ceased (Cedarholm, 1983). Data provided by Gualala Redwoods
Inc.
|
 |
The median
particle size distribution of the streambed at several locations in Wheatfield
basin in 1997 and 2000 is at left. All values except the 2000 measurement
at WF#226 CS1 are under the suggested TMDL range of 37 mm. The station WF#226
CS1 also showed an increase from 1997 to 2000. Suggested minimum D50 comes
from the Garcia TMDL and was intended to be applied to third order streams,
while the Wheatfield is 5th order. Bedload mobility would limit salmonid
spawning success at these locations. Data provided by Gualala Redwoods Inc.
|
 |
The chart
at left shows the median particle size distribution of the streambed at
several locations in the lower South Fork and mainstem Gualala River. All
values except two within Big Pepperwood Creek (PW) are under the suggested
TMDL range of 37 mm, which is the reverse of what is expected since the
other streams are of higher stream orders. Spawning success is likely to
be limited due to bedload mobility at these locations. Data provided by
Gualala Redwoods Inc. Other location codes are GUAL = mainstem Gualala,
SFG = lower SF Gualala.
|
 |
The
chart at left shows North Fork Gualala sampling locations had high fine
sediment (< 0.85 mm), which is the size class most likely to reduce salmonid
spawning success. Values at all stations fluctuated to levels higher than
TMDL target of 14% in at least some years. Trends show higher values in
the Little North Fork at sites (lnf202 and lnf255) after the January 1997
storm, which would be consistent with sediment delivery by that event. Robinson
Creek shows a smaller increase from 1995 to 1997. The increase in fines
on McGann Creek suggests that a pulse of sediment was delivered to that
stream in 1996. Fluctuations in fine sediment of this size class shows that
this fraction is highly mobile. If sediment sources were not continuing,
the trend in this metric would be down.
|
 |
The chart
at left shows a measurement of sediment in pools (V*) for Fuller Creek and
Grasshopper Creek in the Gualala basin as well as a number of other north
coast locations from Knopp (1993). Fuller Creek is in recovery from past
logging damage and has approximately 36% of the volume of pools measured
filled with sediment while Grasshopper Creek had a V* of 0.59 or 59% of
its pool volume filled. Knopp (1993) found a strong relationship between
intensity of watershed management and sediment volume in pools. V* can be
a valuable and cost-effective measure of trends in pool depth and volume.
|
 |
The chart at left shows the sources of sediment estimated by the Technical Support Document (TSD) for the Gualala TMDL which was formally titled the "Technical Support Document for the Gualala River Watershed Water Quality Attainment Action Plan for Sediment" (CRWQCB, 2001). The large basin comparison shows that the North Fork has the highest estimated sediment yield and that mass wasting (MW) associated with roads is the largest sediment source. Sediment yield is shown as tons of sediment yielded per square mile per year. |
Habitat typing data can also be used to analyze sediment impacts on habitat. For example, high sediment yield reduces pool frequency and depth and increases embeddedness. See Fish Habitat Information in KRIS Gualala page for further discussions.
![]()
References
Barnard, 1992. Physical and Chemical Conditions in Coho Salmon (Oncorhynchus kisutch) Spawning Habitat in Freshwater Creek, Northern California. Masters Thesis. Humboldt State University, Arcata, CA. 81 p. plus appendices.
California Regional Water Quality Control Board (CRWQCB). 2001. Technical Support Document for the Gualala River Watershed Water Quality Attainment Action Plan for Sediment. CRWQCB, Region 1. Santa Rosa, CA. 147 pp.
California Resources Agency. In Review. Gualala River Watershed Synthesis. CA Dept. of Fish and Game, State Water Res. Control Bd., CA Dept. of Water Resources, CA Div. on Mines and Geology and CA Dept. of Forestry. Sacramento, CA. Draft released January 16, 2001.
Cedarholm, C.J. 1983. Clearwater River wild steelhead spawning timing. Proceedings of Olympic Wild Fish Conference. Peninsula College, Port Angeles, Washington.
Dietrich,W. E., J.W. Kirchner, H. Ikeda, and F.Iseya. 1989. Sediment supply and the development of the coarse surface layer in gravel-bedded rivers. Nature. Vol. 340: 215-217.
Hilton, S. and T.E Lisle. 1993. Measuring the Fraction of Pool Volume Filled with Fine Sediment. Res. Note PSW-RN-414. US Forest Service, Pacific Southwest Research Station. Albany, CA . 11 pp.
Knopp, C. 1993. Testing Indices of Cold Water Fish Habitat. North Coast Regional water Quality Control Board, Santa Rosa, CA. Cooperatively sponsored by the USDA Forest Service.
McBain and Trush. 2000. Spawning gravel composition and permeability within the Garcia River watershed, CA. Final Report. Prepared for Mendocino County Resource Conservation District. 32 pp. without appendices.
McHenry, M.L., D.C. Morrill, and E. Currence. 1994 . Spawning Gravel Quality, Watershed Characteristics and Early Life History Survival of Coho Salmon and Steelhead in Five North Olympic Peninsula Watersheds. Port Angeles, WA. 59 pp. without appendices.
National Marine Fisheries Service. 1996. (Table 1 from...) Coastal Salmon Conservation: Working Guidance for Comprehensive Salmon Restoration Initiatives on the Pacific Coast. US Dept. Commer, NOAA. 4 pp.
Parrish, Janet. Personal communication. U.S. Environmental Protection Agency, San Francisco, CA.
Sigler, J.W., T.C. Bjornn, and F.H. Everest. 1984. Effects of Chronic Turbidity on Density and Growth of Steelheads and Coho Salmon. Transactions of the American Fisheries Society. 113:142-150.
US Environmental Protection Agency (USEPA). 1998. (Final) Garcia River Sediment Total Maximum Daily Load. Dated 16 March 1998. USEPA, Region IX. San Francisco, CA. 51 pp.
U.S. Environmental Protection Agency. 2000. Ten Mile River, Total Maximum Daily Load for Sediment. Region IX. San Francisco, CA. 89 pp.
![]()
| www.krisweb.com |