
| Area | Buckeye Creek |
| Topic | Temperature: Maximum Floating Weekly Average (F) Buckeye Cr 1994-2001 |
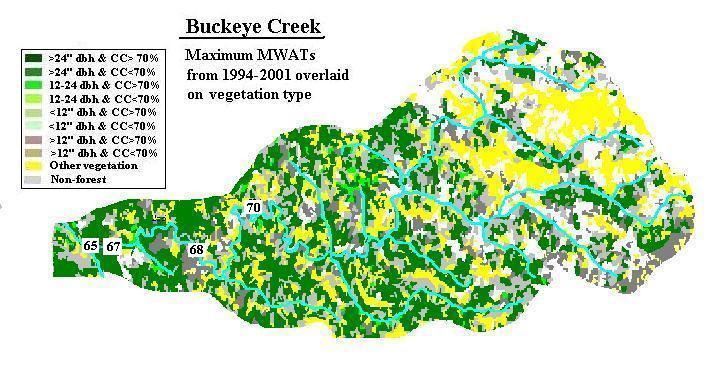
The map image above shows the Buckeye Creek drainage with a vegetation and timber size class color scheme developed from a 1994 Landsat image classified by the USFS Spatial Analysis Lab in Sacramento as well as MWATs in Fahrenheit. Although the mainstem cools from east to west, all stations are above optimal for steelhead growth and above temperatures known to be suitable for coho salmon rearing (62.25 F according to Welsh et al., 2001).
The map image above was provided by the North Coast Regional Water Quality Control Board and shows monitoring sites for temperature and sediment (D50) in Buckeye Creek, tributary to the Gualala River.
The Chart above was taken from Appendix 9 of the Gualala River Watershed Synthesis Report and represents Gualala River locations versus sites labeled "old growth" and is intended to show that water temperatures in smaller streams are naturally cooler than larger streams. The relationship represents data from Henry Alden of Gualala Redwoods, Inc. who also provided information about the old growth sites: "The old growth watersheds, by increasing acreage, are Cow Creek (93% uncut old growth), Squaw Creek (61% uncut old growth) Canoe Creek (62% uncut old growth) and Bull Creek, where the stream flows through 3 miles of uncut old growth, including the Rockefeller Grove, before it gets to the Bull Creek temperature station."
 Click on image to enlarge (77K).
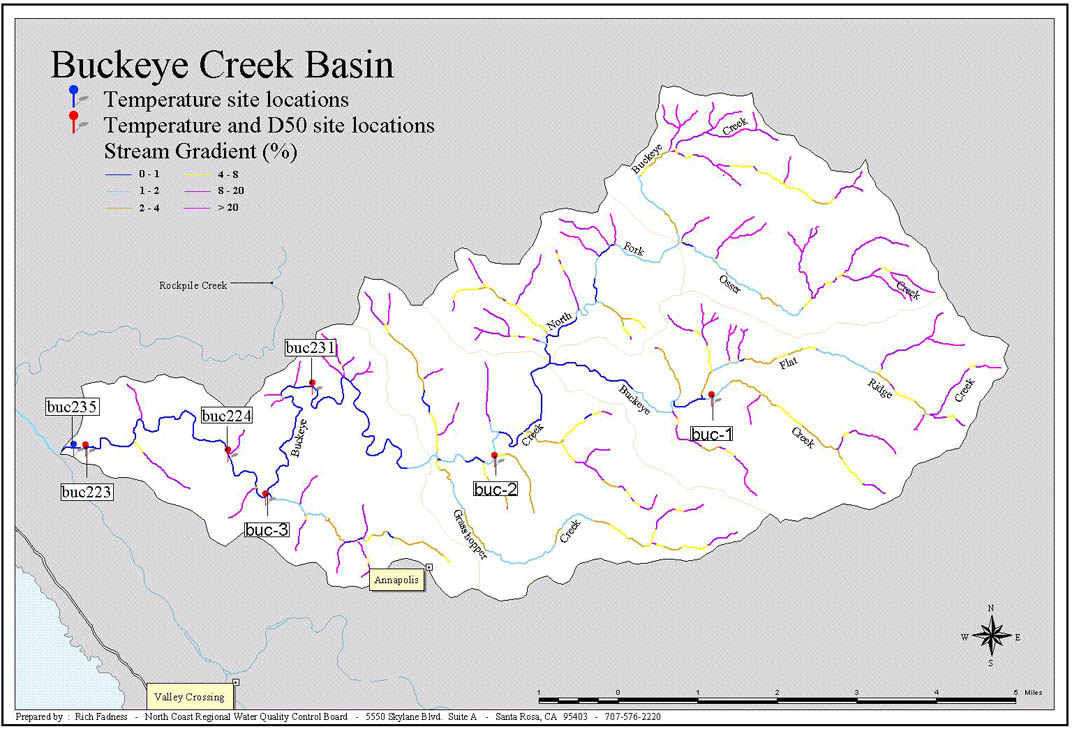 Click on image to enlarge (171K).
 Click on image to enlarge (17K).
To learn more about this topic click Info Links
| www.krisweb.com |