Bibliography Background About KRIS
KRIS Gualala Info Links
Gualala River Flow and Regional Rainfall Data
Flow data in KRIS Gualala comes from U.S. Geologic Survey (USGS) records for the South Fork Gualala River at two locations (Annapolis and near Sea Ranch). Records of average daily flow are in cubic feet per second. Water years begin on October 1 of the prior calendar year. For example, the 1998 water year started on October 1, 1997. The Sea Ranch Gauge data is incomplete with values missing for the first six months of 1992. Rainfall is available in KRIS Gualala for Fort Ross, Healdsburg and Ukiah. These gauges must serve because there are no calibrated rainfall stations within the Gualala basin. Data origin is the National Weather Service NCDC database and James Goodridge, former state climatologist and now consultant to the California Department of Water Resources. Fort Ross is just outside the Gualala basin to the southwest and serves well as an indicator of Gualala basin coastal rainfall. See a note regarding changes in average rainfall at the Ft Ross gauge between the earlier period of 1872-1920 and from 1920-2001. Ukiah and Healdsburg are well outside the basin to the east and are presented as an indicator of regional, long-term rainfall patterns, but they might not be representative of upper Gualala rainfall.
Historical Photos Courtesy of the Held-Poage Museum and Mendocino Historical Society
Historical photos in the KRIS Gualala project were scanned from the collection at the Held-Poage Museum and Library in Ukiah. These historical images allow us to see channel conditions and land use and gain valuable insight into an era before scientific data was collected. Photo negatives were collected by Robert Lee who developed the prints on display at Held-Poage. Photos date back as early as the 1860s. Notes are from Mr. Lee and numbers in his reference system are entered in the captions for the photos. The images are for viewing in this project only and further use of these photos requires the express and written permission of the Mendocino Historical Society.
Historical Photos Courtesy of the Fiscus Family
Ken Spacek, a long time Gualala area native, made arrangements for the KRIS Institute for Fisheries Resources team to scan the Fiscus family photos. Many of these pictures show the life styles and people of the day, but others depict landscape and river scenes. Many thanks to Alice Fiscus for sharing her family treasures. No commercial use of these images is allowed without permission of Alice Fiscus.
Road Densities in KRIS Gualala
Roads are a major source of sediment to streams. Surface erosion from roads can produce chronic sources of fine sediment which can diminish salmon and steelhead spawning success. Failure of roads during major storm events can lead to large landslides which can overwhelm streams with sediment, thus filling pools and diminishing habitat diversity. Road densities in KRIS Gualala are taken from coverages developed by the University of California Davis (ICE) for the Gualala River Watershed Technical Support Document for the Total Maximum Daily Load for Sediment (CRWQCB, 2001). Road maps were developed from aerial photographs for the year 2000. Road densities were calculated by the KRIS IFR spatial data analyst, Dr. Paul Trichilo. The threshold of three miles per square mile on KRIS Gualala charts comes from Cedarholm et al. (1981) and is similar to NMFS (1996) guidelines of 2.5 miles/sq. mile for properly functioning watershed condition. See Roads Background pages for more information.
The Gualala River has a history of supplementation with hatchery coho salmon and steelhead trout juveniles, which is recorded as far back as 1969. The most recent plants from CDFG include 12,000 to 20,000 coho smolts, from 1995 to 1997 in the Little North Fork Gualala River. The data in KRIS Gualala, while originally from the California Department of Fish and Game (CDFG) and the Gualala River Steelhead Project (GRSP), were assimilated as part of the Assessment of Aquatic Conditions in the Mendocino Coast Hydrologic Unit (CWRCB, 2001). See table of plants. Most coho plants used fish of Noyo River origin. CDFG steelhead plants during the 1960s and 1970s were from the Mad River Hatchery. More recent planting of steelhead by the GRSP used rescued native steelhead that had been stranded, which were raised to yearling size in tanks. For further discussion, see the Hatchery Background page.
Fisheries Data in KRIS Gualala
Fisheries data in KRIS Gualala come mostly from California Department of Fish and Game (CDFG) surveys from different eras, although few attempts were made to actually calculate Gualala salmon and steelhead populations. Additional data in recent years also comes from steelhead redd surveys by DeHaven (2001, 2002). CDFG data are comprised of electrofishing catches, seining of the estuary/lagoon, direct dive observations, visual estimates and creel census.Visual Estimates: CDFG surveys from the 1960's and early 1970's (Poole and Parker, 1964; Parker, 1964; Klamt and Edwards, 1970) included visual estimates of juvenile steelhead, coho and other fishes present. The abundance of fish was estimated as the number of fish by species per hundred feet of stream visually but with considerable effort (Bob Klamt, personal communication). While these estimates are not useful for estimating the adult population at that time, they are indicative of the relative standing crop of juveniles and a fair representation of community structure (see Higgins, 1997). The species compositions and notes on size classes of fish steelhead represented can also be useful in comparison.
Electrofishing Quantitatively and Non Quantitatively: This sampling technique uses electricity to stun fish which are then netted, identified to species, weighed and counted then released. Electrofishing is generally conducted during low flow conditions from June through October and is used to sample juvenile fish. This technique was used quantitatively by Weldon Jones (CDFG staff) in index reaches of the North Fork Gualala whereby a specific and consistent habitat area was sampled to calculate densities and biomass of all species present, including amphibians. These latter represent the highest quality of data because techniques did not vary during annual samples from 1988 to 1999. Cox (1995) also used block nets to sample discrete reaches of Fuller Creek and to estimate the density of juvenile steelhead, but only periodic samples were taken. EIP Associates combined direct dive observation with electrofishing in an extensive survey of the lower South Fork Gualala River in July 1991, October 1991 and October 1993 (EIP, 1994).
Most other electrofishing in the Gualala basin was done non quantitatively, where no block nets were used and only one pass was made with the electrofisher. The first fisheries data available from the Gualala is electrofishing by Kimsey (1952) of the lower Gualala River. One pass electrofishing was also frequently carried out in conjunction with habitat typing, including over 100 miles surveyed by CDFG in 2001. Although these electrofishing samples are not useful for gauging densities, biomass and standing crops, they can be used as an index of fish community structure. For example, the mix of coho and steelhead and its change over time reveals information about habitat change and suitability (Higgins, 1997). Non detection of a species, such as coho salmon , cannot be taken as total absence.
Fish Dive Counts: The lower South Fork Gualala below the Wheatfield Fork was surveyed using dive observations in October 1993 by EIP Associates (1994). Direct dive observation was also used in many Gualala reaches in 2001 as part of a north coast wide coho presence and absence survey by CDFG following NMFS protocols (Adams et al., 1999). Only pools are sampled in these surveys and surveys stop after coho have been identified or ten pools are surveyed. Because the varying returns of different year classes of coho, three consecutive years of survey are be needed for definitive presence/absence information. (See the Status of Pacific Salmon in Northwestern California background page for more information). Halligan (1999) also used direct dive observation in a survey of selected Gualala River and tributary reaches. None of these dive surveys met the rigor of Hankin and Reeves (1988) to allow population estimates for the Gualala basin.
Creel Census/Adult Steelhead Population Estimate: In the 1950's and early 1970's angler catch rates of adult salmon and steelhead were calculated for the Gualala River (Boydstun, 1974a, 1976a, 1976b). These samples recorded data on the number of fish caught, those released and those killed, and catch-per-unit-effort (cpue) for anglers. The effort in the 1970's also included capturing adult steelhead in the lower river and estuary with seine nets and tagging and releasing them so that a population estimate could be generated (Boydstun, 1976a and 1976b). The latter was calculated from a ratio derived from the number of tagged and un-tagged fish harvested by anglers. See discussions in Higgins (1997) by searching on keyword Boydstun in Adobe Acrobat Reader.
Downstream Migrant Trapping: The California Department of Fish and Game collected data on Pepperwood Creek (lower SF Gualala) in 1974 using a downstream migrant trap. Results of downstream migrant traps are better indicators of fish community structure than electrofishing because of much more extensive sampling effort. Fyke nets may be biased with regard to capture of larger juvenile salmonids such as yearling and older steelhead because they may avoid the trap.
Estuary Seining: Brown (1986) sampled the Gualala estuary at several locations using a seine net during 1984 and 1986. Juvenile steelhead and other species were captured, identified to species, measured, weighed and released. Garcia River estuary seining data collected by Higgins (1996) is also displayed in KRIS Gualala for size comparisons. See the discussion of the difference in the size of juvenile steelhead captured in Higgins (1997).
Steelhead Redd Survey 2001-2002: DeHaven (2001) surveyed steelhead redds along 59 miles of the Gualala River and its tributaries on foot and by boat between February and April 2001. Streams surveyed included Britain, Haupt, House, and Rockpile creeks as well as reaches of the South Fork and Wheatfield Fork Gualala River. In 2002, surveys were carried out mostly by boat on the Wheatfield Fork from the House Creek to the South Fork () and counted redds, live fish and carcasses. DeHaven (2002) discusses means to standardize redd counts and has notes on how to avoid errors in counts, such as mistaking lamprey redds for steelhead redds.
For more in-depth information see the background page for Fish Population and Fish Population Information in KRIS Gualala.
The California Department of Fish and Game (CDFG) surveyed over 100 miles of the Gualala River and its tributaries in 2001. Surveys followed the protocols from the California Salmonid Restoration Manual (CDFG, 1998), which are similar to and derived from McCain et al. (1990). Habitat typing data were also collected in Fuller Creek in 1995 (Sotoyome RCD, 1996) and by CDFG in MacKenzie Creek in 1999.
Entrix, Inc. surveyed the North Fork Gualala River, and its tributaries Little North Fork and Doty Creek, in September 1994 (Entrix, Inc., 1995a, 1995b, 1995c) for Gualala Redwoods, Inc. The surveys were conducted by trained personnel and followed standard habitat typing protocols recognized by CDFG and the United States Forest Service, Region 5 (McCain, 1990). The habitat typing surveys conducted by CDFG in 2001 in Doty Creek, Little North Fork and the North Fork were identical to reaches surveyed by Entrix, Inc. in 1994. Comparison is made in KRIS Gualala of maximum pool depths between the 1994 and 2001 survey results. Both surveys were conducted during very dry years, which would negate any difference in pool depth related to flow. This is slightly significant since CDFG methods do not call for measuring the pool tail depth and calculating residual pool volume. Most habitat typing results are not comparable because of observer bias, but pool depth is a repeatable, physical measurement.
To learn more about using fish habitat data, check the Habitat Typing background pages. For a full discussion of the discrepancies between CDFG and KRIS stream orders, see the Stream Orders in KRIS Projects Background page. Canopy measurements in habitat typing do not give a full picture of riparian health. See the Riparian Information in KRIS Gualala Background page to learn more about what role canopy plays in proper riparian function.
Coastal Forest Lands (now Pioneer Resources) conducted a Watershed and Aquatic Wildlife Assessment (CFL, 1997), which included large wood surveys in Fuller Creek, Rockpile Creek, Buckeye Creek and the North Fork Gualala River. Survey methods followed those advanced by the Washington State Timber, Fish and Wildlife protocols. Data were extracted from the Assessment of Aquatic Conditions in the Mendocino Coast Hydrologic Unit (CWRCB, 2001) where a fuller description of survey methods and discussion of results can be reviewed (p. 244). See the Large Wood background page to learn more about the role of large wood in shaping aquatic habitats.
Gualala River Sediment Source Analysis (TSD/TMDL)
KRIS Gualala draws on the Technical Support Document (TSD) for the Gualala River Watershed Water Quality Attainment Action Plan for Sediment (CRWQCB, 2001) for data on sediment source analysis. The TSD calculated sediment yield from various sources and sub basins in the Gualala River watershed in support of the TMDL process. The following is from the TSD:
"The primary objective of the Gualala River Watershed TSD for Sediment is to identify and initially quantify sources of sediment delivery in a way that allows a relative comparison of those sources and to provide information required for non point source implementation and planning. A secondary objective of the Gualala River Watershed TSD for Sediment is to identify sediment loading allocations that, when implemented, are expected to result in the attainment of the applicable water quality standards for sediment to protect beneficial uses. The key beneficial uses of concern are associated with cold water fisheries, particularly the coho salmon (Oncorhynchus kisutch) and steelhead trout (Oncorhynchus mykiss) fisheries."
The California Geologic Survey (CGS) has reservations about some assumptions in the TSD and its calculation of sediment from large landslides (Sterling, 2002a, 2002b). No comparable data for sediment budget were available from CGS. For a summary of findings of the TSD see an excerpt from the report. The categories found in charts and tables were described by CWRCB (2001) as follows:
- "Natural Mass Wasting: Mass wasting (landslides, debris flows, etc.) not influenced by anthropogenic activities. Note that earthflow delivery has been incorporated into the stream bank erosion estimate.
- Stream Bank Erosion: Sediment delivered to stream channels by soil creep and earthflow processes.
- Road Related Mass Wasting: Mass wasting (landslides, debris flows, etc.) originating from roads. Estimate was generated from aerial photo analysis and field measurement of random plots.
- Road-Stream Crossing Failures: Sediment delivery associated with erosion caused by stream crossings, including outlet erosion, stream diversions, and washouts. (This is almost certainly an underestimate due to the fact that stream crossings are often repaired after failure.)
- Road Related Gullying: Sediment delivery associated with gullies caused by road runoff. Estimate was generated from field measurements of random plots and main-haul road survey.
- Road Related Surface Erosion: Sediment delivery of eroded road surface materials.
- Skid Trail Surface Erosion: Sediment delivery from surface erosion of skid road and trail surfaces.
- Other Harvest Related Delivery: Sediment delivery associated with landings, skid roads and trails not accounted for elsewhere. This estimate was generated from the aerial photo analysis and field measurement of random plots and includes both mass wasting and fluvial erosion of skid trails and landings adjacent to streams."
Sediment Measurements: McNeil Samples, Median Particle Size (D50) and Pool Volume (V*)
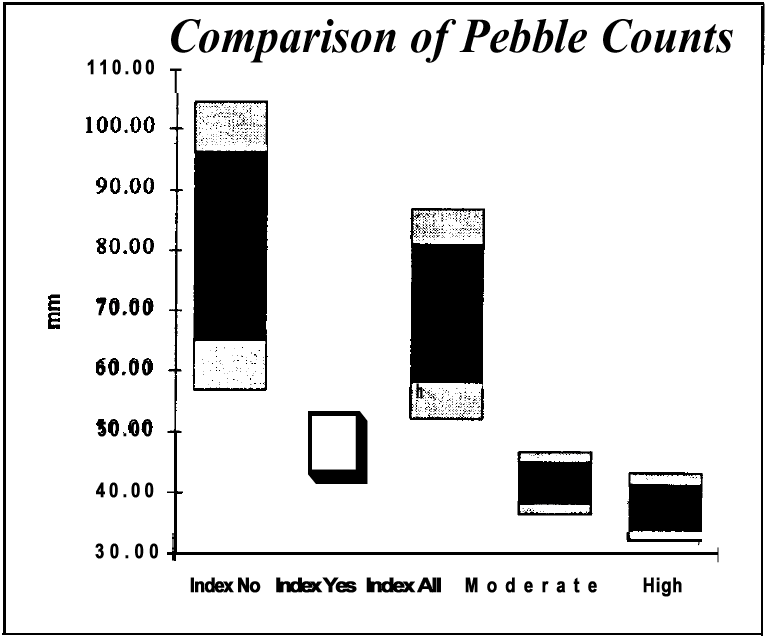
McNeil (bulk gravel) sample data in KRIS Gualala were collected by the Gualala Redwoods Inc. (GRI) and the data were made public through timber harvest plans. These samples were taken from various locations in the North Fork Gualala basin from 1992 to 1997.The median particle size (D50) was measured by GRI for all streams within its holdings from 1997 to 2001 and provided with timber harvest plans. D50 is derived from pebble counts using methods similar to those employed by Knopp (1993), whose regional data are also included in KRIS Gualala. Pebble Counts are conducted at cross-section sites within established monitoring reaches using the basic Wolman (1954) technique. One hundred pebbles are chosen and measured along a transect that crosses the riffle and is within bankfull. KRIS Charts shows a D50 range of 52-88 mm that is defined by the Knopp 95% confidence interval for mean particle size of control streams or those that had at least 40 years rest from logging (see Knopp disturbance classes). The Garcia TMDL (US EPA, 1996) had a suggested minimum D50 of 37 mm for third order streams, based on Knopp's (1993) results. Small median particle size can contribute to bedload mobility, which decreases salmonid spawning success (Nawa and Frissell, 1993). Factors that effect median particle size are gradient, stream order and channel confinement. O'Connor (2002) states that Gualala Redwoods, Inc. D50 values are not comparable to Knopp (1993) due to the low gradient at all stations (<1%). See the Sediment in KRIS Gualala Background page for more discussion.
Knopp (1993) also measured pool volume and other stream bed characteristics in Fuller Creek and Grasshopper Creek in the Gualala Basin as part of a 60 stream regional study. The proportion of a pool's residual volume that is filled by fine sediment is termed V-star (Hilton and Lisle, 1993).
For more information on how sediment effects fish, methods of sampling and justification for references used in KRIS Gualala charts, see the Sediment Background page.
Map Images in KRIS Gualala from ArcView Map Project
Map images in the KRIS database come from the KRIS Gualala Map project. All KRIS database projects have complementary map projects in the program ArcView, which are included on a separate CD free from the California Department of Forestry. The KRIS Gualala Map project contains information from the U.S. Forest Service Spatial Analysis Lab in Sacramento, U.S. Geological Survey, U.S. Natural Resources Conservation Service, U.S. Environmental Protection Agency, California Department of Forestry, Department of Fish and Game, and the State Water Resources Control Board North Coast District. No electronic mapping data, however, was provided by the Department of Conservation Division of Mines and Geology. Projects are made using the Spatial Analyst extension but grid data, such as vegetation types, are converted to images so that projects can be opened without the extension. Projects are also adapted for use in Arc Explorer so that KRIS users lacking ArcView can also review spatial data. See Map Background pages for sample views and tips on use in analysis. Call CDF at (916) 227-2652 for free KRIS Gualala Map project CD.
Tree Size Classes of Cal Water Watersheds and Riparian Zones
The tree size classifications used in the KRIS Gualala project were derived from Landsat multi-spectral images taken in 1994. The U.S. Forest Service Pacific Southwest Region Remote Sensing Lab, in cooperation with the California Department of Forestry, analyzed the Landsat images to formulate a California wide electronic map layer of vegetation as part of the Northwest Forest Plan (Warbington et al., 1998). See Vegetation Types Background page for more information)Stand conditions are accurately represented at the one hectare scale by the USFS vegetation data. Data is quarried for tree size or community type in KRIS Gualala Maps. This allows quantitative assessment of vegetation types for seral stage based on tree size for geographic areas such as CalWater Planning Watersheds in KRIS DB. CDF FRAP change scene detection (Fisher, 2001) using 1994 and 1998 Landsat imagery allows assessment of conditions in a more recent time frame. Change scene detection themes are available in the KRIS Map ArcView and ArcExplorer projects (see Land Cover Maps page)
For use in KRIS, vegetation and timber types were simplified into ten classifications. Vegetation classifications are:
Very Large Trees = 40" in diameter or greater
Large Trees = 30-39.9" in diameter
Medium/Large Trees = 20-29.9" in diameter
Small/Medium Trees = 12-19.9" in diameter
Small Trees = 5-11.9" in diameter
Saplings = 1-4.9" in diameter
Non Forest = Non tree species such as shrubs, grasses or bare soil
This simpler classification provides an easy to understand index of watershed disturbance for use in coastal watersheds. Large components of early seral stage conditions (Saplings, Non Forest) are often associated with recent logging disturbance. The vegetation patterns in interior basins, such as the Eel River and Klamath River watersheds, are much more complicated than in coastal ecosystems and more difficult to use to analyze changes in vegetation brought about by watershed management activities. The KRIS vegetation classification scheme can also be used for a quick analysis of riparian conditions (see Gualala Riparian page). Ninety meter (297 ft.) zones of riparian influence are assigned to the 1:24000 stream layer in ArcView and only the vegetation within this zone is displayed and analyzed.
Timber Harvest Data in KRIS Gualala
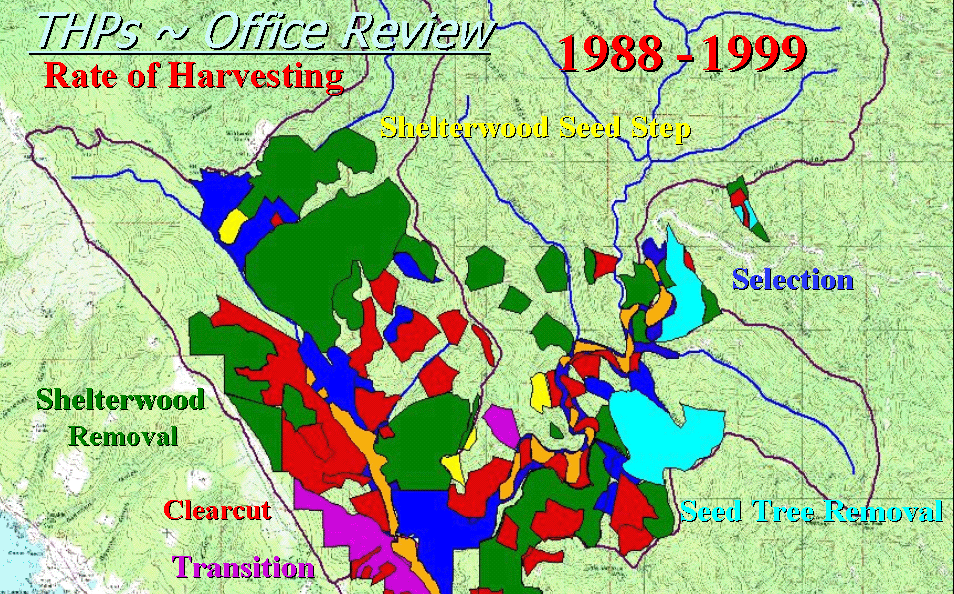
Timber harvest data in KRIS comes from the California Department of Forestry (CDF) and the National Marine Fisheries Service (NMFS). The CDF data only covers from 1990 to 2001, while data spanning back to 1985 would have been more useful in analysis for cumulative watershed effects. CDF data are included in their entirety in the KRIS Gualala Map project and contain information on timber harvest type, acres, year, ownership and other parameters. Don Morse of CDF FRAP also digitized timber harvests from 1945-1970 as part of the NCWAP program, although those are available only as images in the NCWAP Gualala report. NMFS mapped THPs in the North Fork Gualala from 1986 to 1999 and data were shared with KRIS IFR. Read more about the Timber Harvest maps in the KRIS project.
Non-spatial quantitative data used in KRIS Gualala for timber harvests were calculated by Dr. Paul Trichilo in ArcView. Harvests for a given area were only counted once, even if there were multiple entries in the 1991-2001 period. Lack of coverage for the years 1985-1990 is a critical flaw in accurate cumulative watershed effects calculation because some of these harvests may have been delayed until the early to mid 1990's and still have the potential to yield sediment. Conversely, timber harvests permitted in recent years (since 1999) may not have been cut yet. See Cumulative Watershed Effects page for more discussion of THP mapping.
Gualala River Water Temperature Data
Stream temperature can be the single most critical feature of habitat for salmonids and is relatively easy to monitor. Gualala Redwoods Inc. (GRI) collected water temperature data on streams throughout its holdings with automated temperature sensing devices since 1992. GRI data appear in KRIS as summary tables and charts built using data provided in timber harvest plans and by GRI in summary form during the NCWAP assessment. The Gualala River Watershed Council (GRWC) used automated temperature probes to measure water temperatures at a number of locations since 2000. The GRWC would not release any monitoring data to IFR, but 2000 water temperature files were provided by the North Coast Regional Water Quality Control Board.
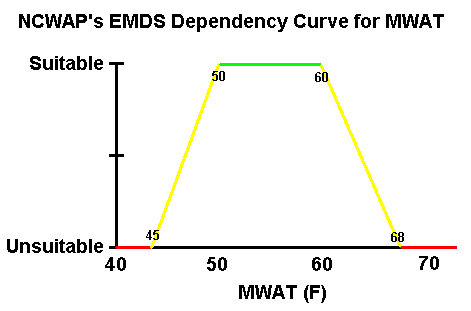
References displayed in KRIS Gualala temperature charts vary between those showing NCWAP suitability ranges (see EMDS Rating Curve) and those used in previous KRIS projects (see Temperature Background page). The critical reference in all KRIS charts within the range of coho salmon, such as the western Gualala River basin, is from Welsh et al. (2001) and Hines and Ambrose (1998). These studies had similar findings regarding the range of temperatures tolerable to coho in northern California.
Note about documents in KRIS