| Area |
Basin-wide/General |
| Topic |
Gualala Basinwide Location Maps |
 Click on image to enlarge (23K).
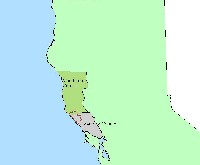
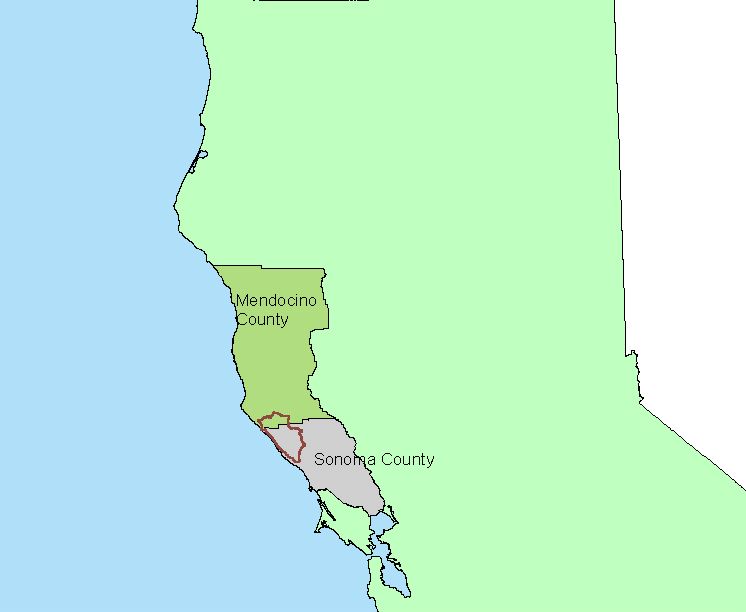
The map image above comes from the KRIS Gualala ArcView project and shows the location of the Gualala basin relative to Sonoma (gray) and Mendocino (olive green) counties and the State of California.
 Click on image to enlarge (46K).
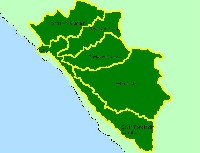
The image above is from the KRIS Gualala Map project and shows the sub-basins used for analysis the KRIS database and in the watershed assessment conducted as part of the North Coast Watershed Assessment Program (NCWAP). The only discrepancy between KRIS and the NCWAP report is that KRIS separates the Gualala Estuary as a study area. These areas were called Super Planning Watersheds in the NCWAP report.
 Click on image to enlarge (72K).
The image above is from the KRIS Gualala Map project and shows the large KRIS and NCWAP sub-basin study areas in yellow and Calwater Planning Watersheds outlined in purple. These "Calwater" watersheds are less than ideal because they do not always define true hydrologic boundaries but they are convenient for assessing landscape condition for discrete areas and are used for that purpose in KRIS. Calwater Planning Watersheds are all less than 10,000 acres.
 Click on image to enlarge (128K).
The image above is from the KRIS Gualala Map project and shows the elevation of the Gualala watershed. The western portion of the Gualala is low relief and marine terraces can be seen near the mouth. Elevation rises in the east to over 800 meters (2650 feet), but steep areas also exist in the North Fork in the northwest part of the watershed. The San Andreas Fault can be clearly seen as the linear feature in the west with the South Fork, mainstem and North Fork Gualala following it.
 Click on image to enlarge (103K). Click here to display a larger version (416K).
The image above is from the KRIS Gualala Map project and shows stream gradient. The large extent of stream reaches with gradient less than two percent (light and dark blue) shows why the Gualala was once a substantial producer of coho salmon. Mild gradients such as these were optimal for this species for both spawning and rearing. The reaches colored red are the steepest tributary areas, which tend to occur at headwaters in the eastern portion of the basin and in the North Fork. A useful stream classification for gradient is from Lunetta et al. (1995) with streams less than 4% being response reaches, 4-12% transport reaches and greater than 12% being supply reaches.
 Click on image to enlarge (64K).
The rainfall isopleths shown above are those generated using the Oregon State University model. The map shows that rainfall at the coast is 30-40 inches annually and that patches in the interior basin may reach 70-80 inches. Image from the KRIS Gualala Map Arc View project.
 Click on image to enlarge (82K).
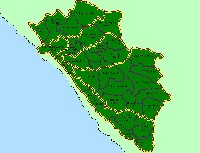
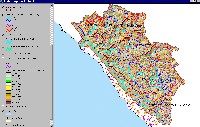
The image above is from the KRIS Gualala Map project and shows vegetation as interpreted from a 1994 Landsat image by the U.S. Forest Service Remote Sensing Lab in Sacramento. The eastern part of the Gualala basin is underlain by Central Belt Franciscan terrain and is, therefore, naturally in grasslands, oak woodlands and mixed oak and coniferous forest. The Ohlsen Ranch Formation in the eastern portion of the upper South Fork also has similar vegetation patterns with non-forest conditions and saplings. The best coniferous timberland is in the lower South Fork and in the western portions of the Wheatfield, Buckeye, Rock pile and North Fork basins. Almost no Very Large or Large Trees remain in the Gualala, except in the South Fork, because of active timber harvest. Medium Large (20-29.9"), Small-medium (12-19.9" diameter) and small trees (5-11.9") predominate in forested areas.
 Click on image to enlarge (67K).
The image above is from the EPA Land Cover project, which is included in the KRIS Gualala Map project. The eastern and southeastern portions of the watershed show as grasslands, shrubland and mixed forest due to Central Belt Franciscan terrain in this region. Patches of mixed forest and shrubland in the central and western portion of the watershed reflect early seral conditions after timber harvest.
To learn more about this topic click Info Links

 Click on image to enlarge (23K).
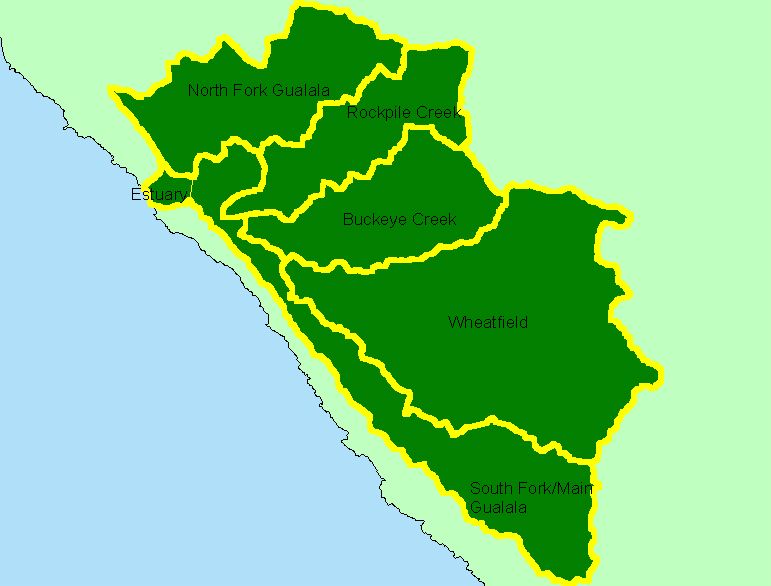 Click on image to enlarge (46K).
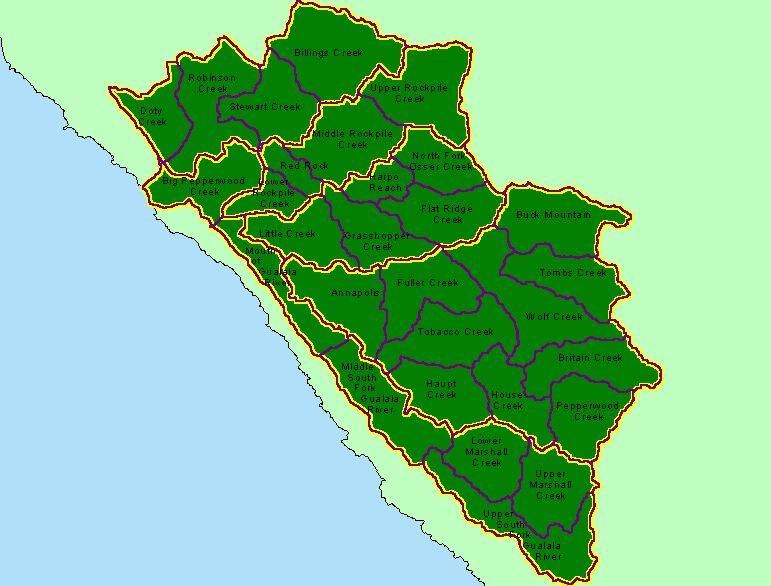 Click on image to enlarge (72K).
 Click on image to enlarge (128K).
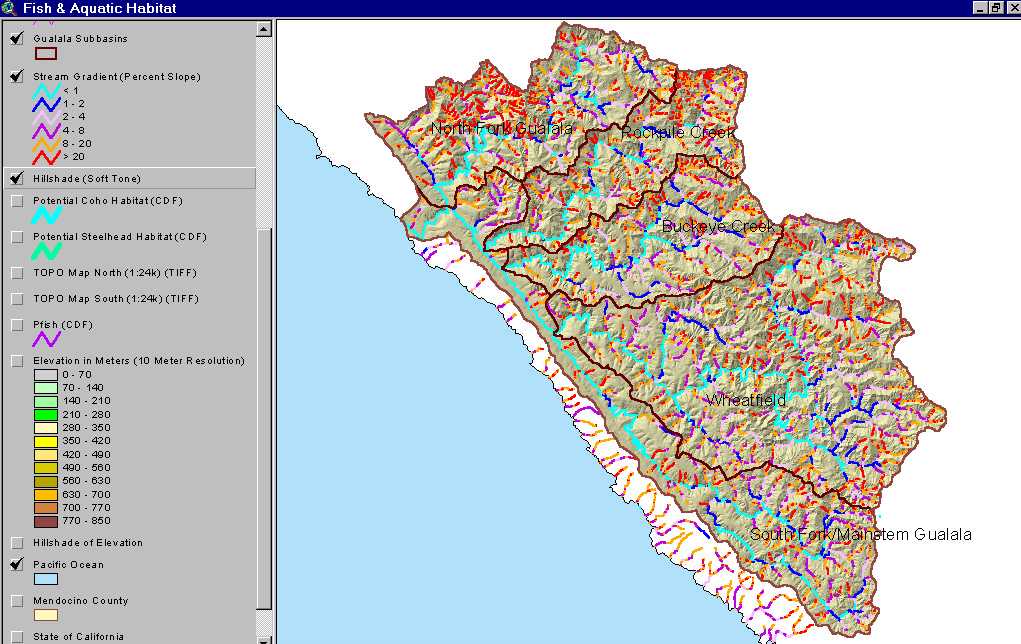 Click on image to enlarge (103K). Click here to display a larger version (416K).
 Click on image to enlarge (64K).
 Click on image to enlarge (82K).
 Click on image to enlarge (67K).
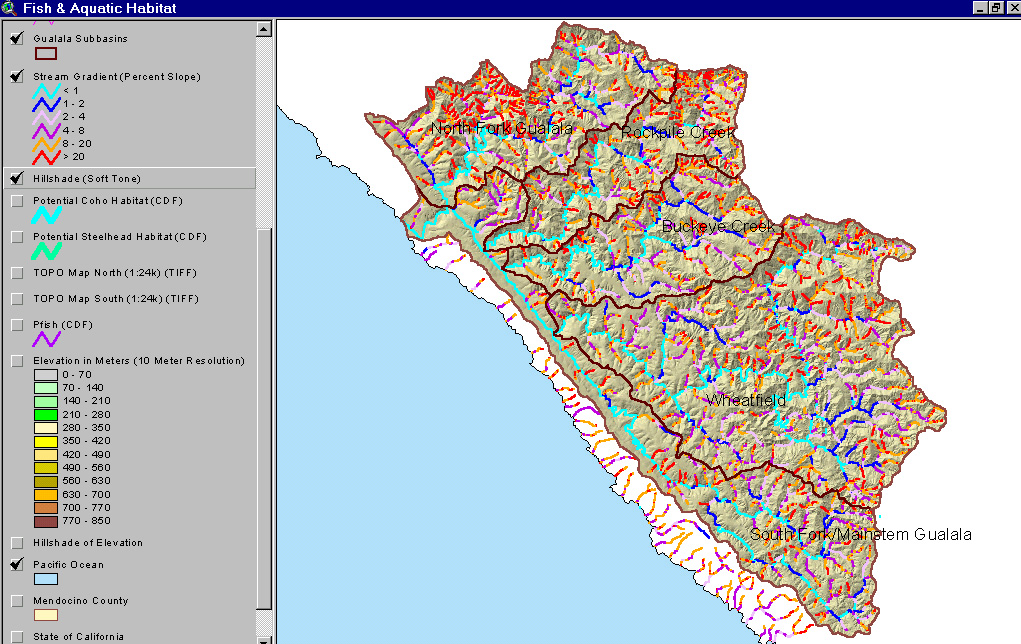