
| Area | North Fork |
| Topic | Temperature: Maximum Floating Weekly Average (F) NF Coho Ref 1994-2001 |
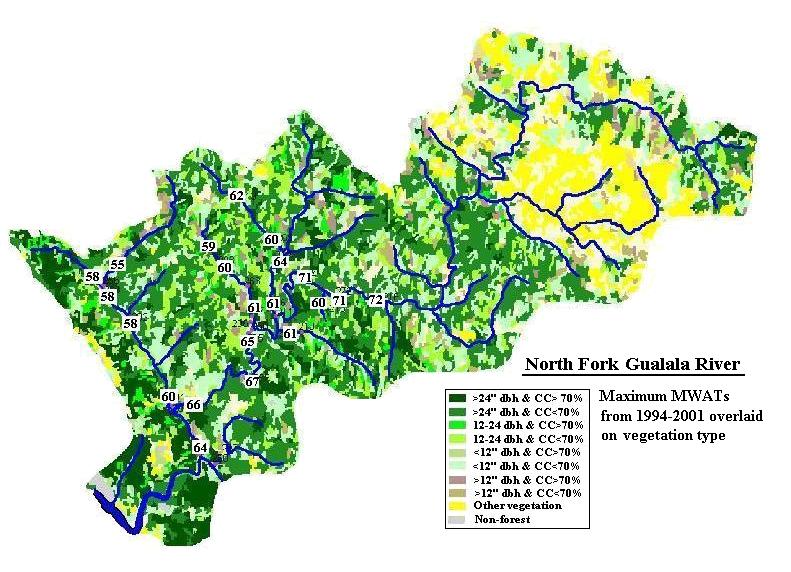
The image of the North Fork Gualala showing vegetation and MWAT (F) by location are from the North Coast Regional Water Quality Control Board. Vegetation information is satellite derived from the USFS Spatial Analysis Lab in Sacramento. Maximum floating weekly average water temperature in Fahrenheit are the maximum values for all years measured. The North Fork cools as it moves west off mélange terrain from 72 F to 65 F below Robinson Creek but warms again above its convergence with the Little North Fork. An MWAT of 62.25 F is the maximum threshold for supporting coho juveniles (Welsh et al., 2001).
The map above comes from the North Coast Regional Water Quality Control Board and shows the maximum floating weekly average water temperatures of the North Fork Gualala and its tributaries based on data provided by Gualala Redwoods Inc. The Little North Fork, Robinson and most locations in Dry Creek recorded fully functional conditions for salmonids. Dry Creek, however, has a very high MWAT of 64 F in its middle reaches. The 61 F MWAT of lower Robison and Dry Creek is elevated due to reduced canopy conditions and aggradation. Although both streams are fully functional in their lower reaches, their buffer capacity to help reduce mainstem North Fork temperatures is compromised. Mainstem North Fork water temperatures are elevated in the east, which is expected because of open canopy conditions associated with Central Belt Franciscan. While the North Fork cools to 65 F downstream of Robinson Creek, it warms again to 67 and 66 F above the LNF. In the cool, foggy lower reach and the cooling influence of the Little NF, the mainstem drops to 18 C above its convergence with the South Fork. Elevated mainstem water temperatures would favor Gualala roach. Coho do not inhabit streams with an MWAT of greater than 16.8 C (Welsh et al., 2001). Click on Info Links for more information.
The Chart above was taken from Appendix 9 of the Gualala River Watershed Synthesis Report and represents Gualala River locations versus sites labeled "old growth" and is intended to show that water temperatures in smaller streams are naturally cooler than larger streams. The relationship represents data from Henry Alden of Gualala Redwoods, Inc. who also provided information about the old growth sites: "The old growth watersheds, by increasing acreage, are Cow Creek (93% uncut old growth), Squaw Creek (61% uncut old growth) Canoe Creek (62% uncut old growth) and Bull Creek, where the stream flows through 3 miles of uncut old growth, including the Rockefeller Grove, before it gets to the Bull Creek temperature station."
 Click on image to enlarge (105K).
 Click on image to enlarge (164K).
 Click on image to enlarge (17K).
To learn more about this topic click Info Links
| www.krisweb.com |