
| Area | Rockpile Creek |
| Topic | Temperature: MWAT Rockpile 1994-2001 w/ Coho Tolerance Reference |
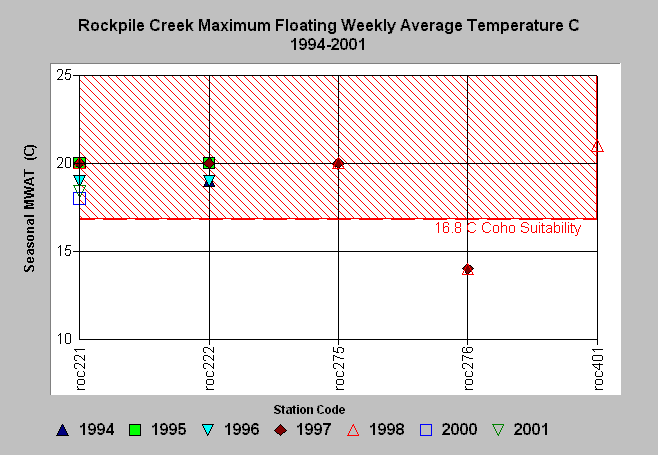
| Caption: The chart above shows the seasonal maximum of the floating weekly average water temperature (MWAT) derived from automated temperature probes placed in Rockpile Creek by Gualala Redwoods Inc from 1994 to 2001. Readings indicate fully functional conditions for salmonids at station roc276 (Little Creek) but other stations were stressful for salmonids and above 16.8 C, which is the temperature above which coho salmon juveniles are not found (Welsh et al., 2001). See Info Links for more information. | |
 |
To learn more about this topic click Info Links .
To view a table of information about this data click Metadata .
To view the table with the chart's data, click Chart Table web page.
To download the table with the chart's data, click rocmwatc.dbf (size 688 bytes) .
| www.krisweb.com |