
| Area | Rockpile Creek |
| Topic | Temperature: MWAT Rockpile 1994-2001 w/ Coho Tolerance Reference |
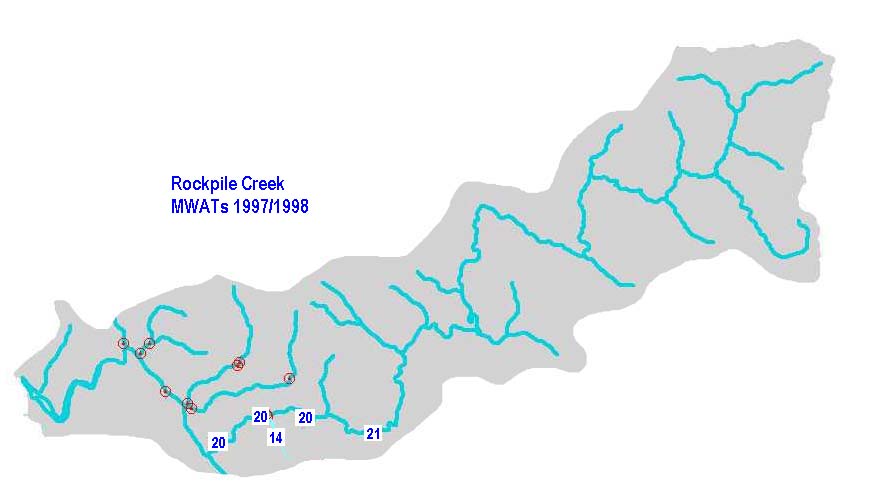
The map above shows the maximum floating weekly average water temperature of lower Rockpile Creek and its tributary Little Creek. Water temperatures were low enough to support coho salmon in Little Creek (14 C), a second order tributary, but too warm to support them at any station in lower Rockpile Creek. Data provided by Gualala Redwoods Inc. Map made by North Coast Regional Water Quality Control Board.
The Chart above was taken from Appendix 9 of the Gualala River Watershed Synthesis Report and represents Gualala River locations versus sites labeled "old growth" and is intended to show that water temperatures in smaller streams are naturally cooler than larger streams. The relationship represents data from Henry Alden of Gualala Redwoods, Inc. who also provided information about the old growth sites: "The old growth watersheds, by increasing acreage, are Cow Creek (93% uncut old growth), Squaw Creek (61% uncut old growth) Canoe Creek (62% uncut old growth) and Bull Creek, where the stream flows through 3 miles of uncut old growth, including the Rockefeller Grove, before it gets to the Bull Creek temperature station."
 Click on image to enlarge (35K).
 Click on image to enlarge (17K).
To learn more about this topic click Info Links
| www.krisweb.com |