
| Area | South Fork |
| Topic | Temperature: Floating Weekly Average at SF/Main GRWC Sites in 2000 |
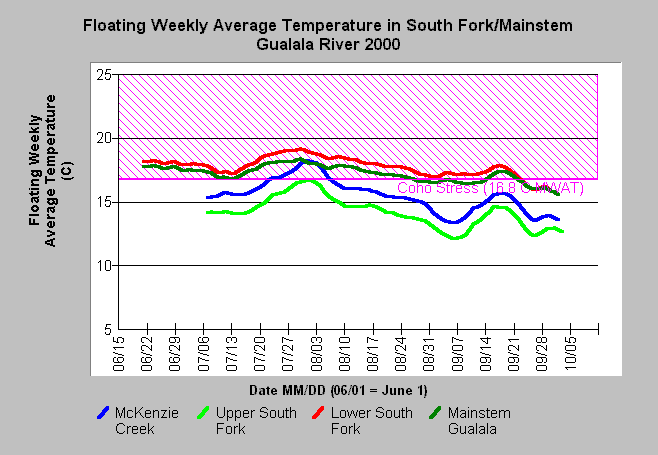
| Caption: This chart shows the floating weekly average temperature at four sites of the South Fork/Main Sub-basin of the Gualala River taken in 2000. While the upper South Fork remained cool enough to support coho, the other sites were above the temperature range known to support them (Welsh et al., 2001). Click on the peak of lines for MWAT value and date. Data are provided by the Gualala River Watershed Council. See Info Links for more information. | |
 |
To learn more about this topic click Info Links .
To view a table of information about this data click Metadata .
To view the table with the chart's data, click Chart Table web page.
To download the table with the chart's data, click tempc_grwc_2000_daily.db (size 63,488 bytes) .
To view the table with the chart's source data, click Source Table web page.
To download the table with the chart's source data, click tempraw_grwc_2000.dbf (size 1,737,254 bytes)
| www.krisweb.com |