
| Area | South Fork |
| Topic | Flow: SF Gualala at USGS Sea Ranch Station 1991-1993 |
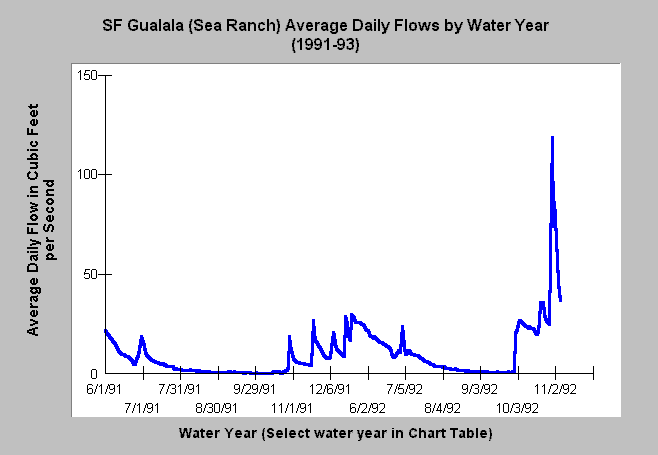
| Caption: This chart displays average daily flows in cubic feet per second by water year for the South Fork Gualala River at the USGS gauge near Sea Ranch for the years 1991-93 only. These years were very dry. The data are from the US Geologic Survey website. The water year typically runs from October 1 of the calendar year prior. You may call up any water year in the record by selecting one in the Chart Table (see instructions there). The Y-axis of the graph may vary depending on the magnitude of the flows in any given year. | |
 |
To learn more about this topic click Info Links .
To view a table of information about this data click Metadata .
To view the table with the chart's data, click Chart Table web page.
To download the table with the chart's data, click gualflowsearnch91_93.dbf (size 11,764 bytes) .
| www.krisweb.com |