| Area |
South Fork |
| Topic |
Temperature: Yearly MWATs for Main/South Fork Watershed Fahrenheit |
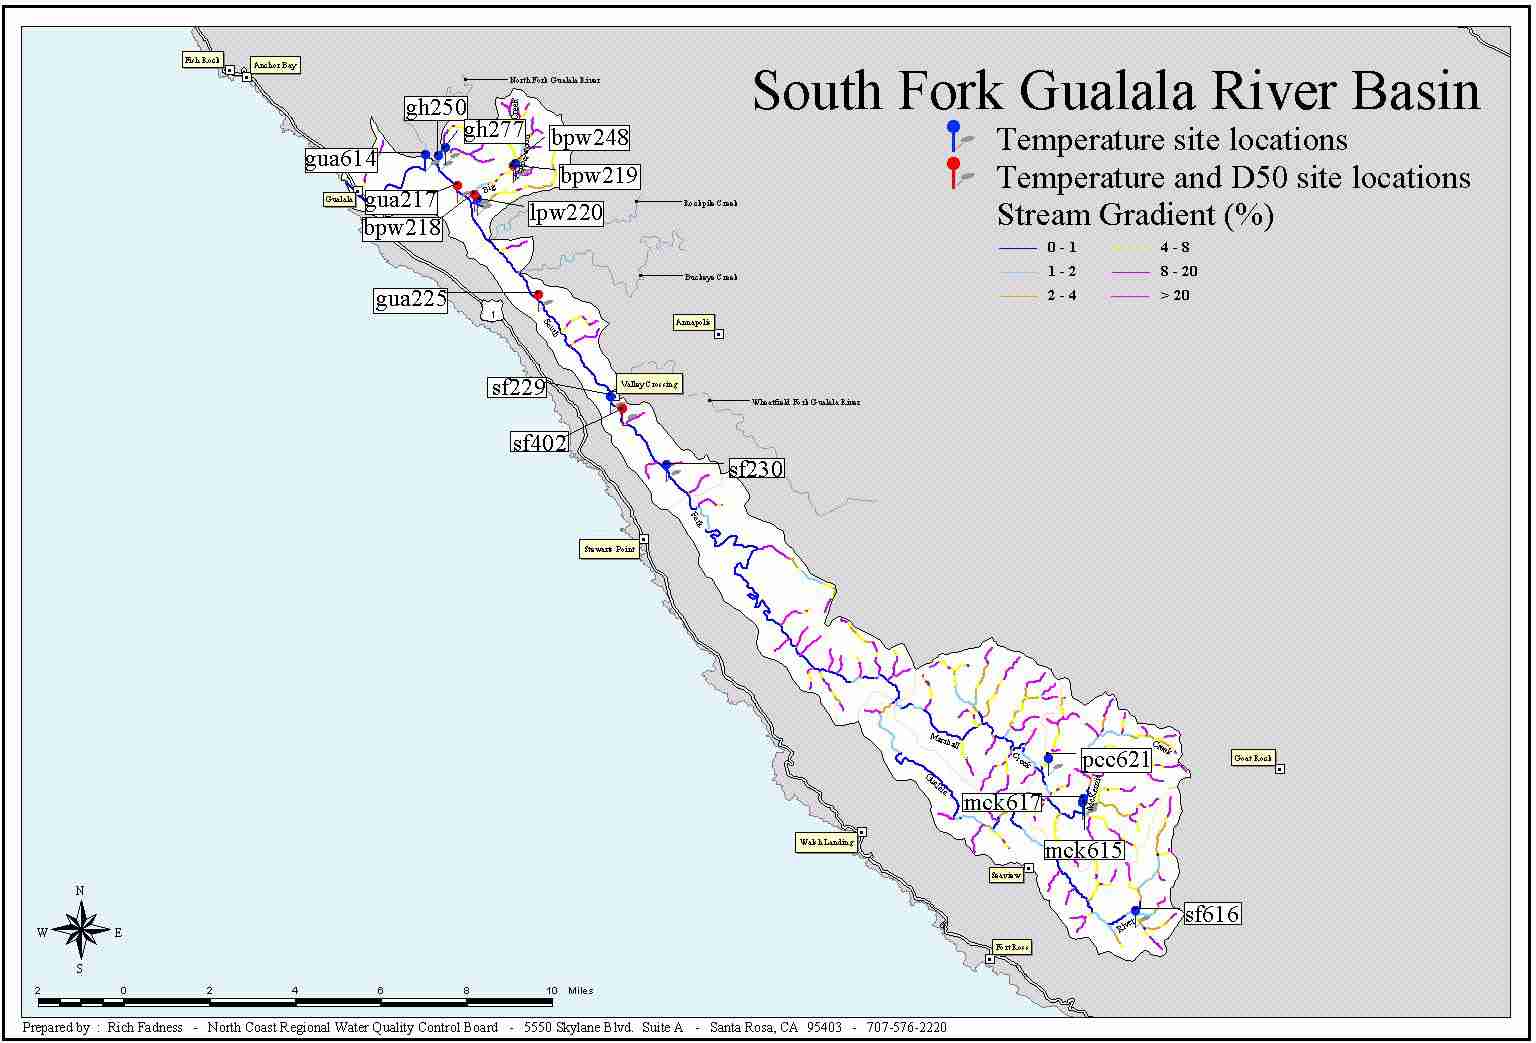
 Click on image to enlarge (100K). Click here to display a larger version (1,453K).
The North Coast Regional Water Quality Control Board provided the map above of water temperature and sediment monitoring stations on the South Fork and mainstem Gualala River and their tributaries.
 Click on image to enlarge (17K).
The Chart above was taken from Appendix 9 of the Gualala River Watershed Synthesis Report and represents Gualala River locations versus sites labeled "old growth" and is intended to show that water temperatures in smaller streams are naturally cooler than larger streams. The relationship represents data from Henry Alden of Gualala Redwoods, Inc. who also provided information about the old growth sites: "The old growth watersheds, by increasing acreage, are Cow Creek (93% uncut old growth), Squaw Creek (61% uncut old growth) Canoe Creek (62% uncut old growth) and Bull Creek, where the stream flows through 3 miles of uncut old growth, including the Rockefeller Grove, before it gets to the Bull Creek temperature station."
To learn more about this topic click Info Links

 Click on image to enlarge (100K). Click here to display a larger version (1,453K).
 Click on image to enlarge (17K).
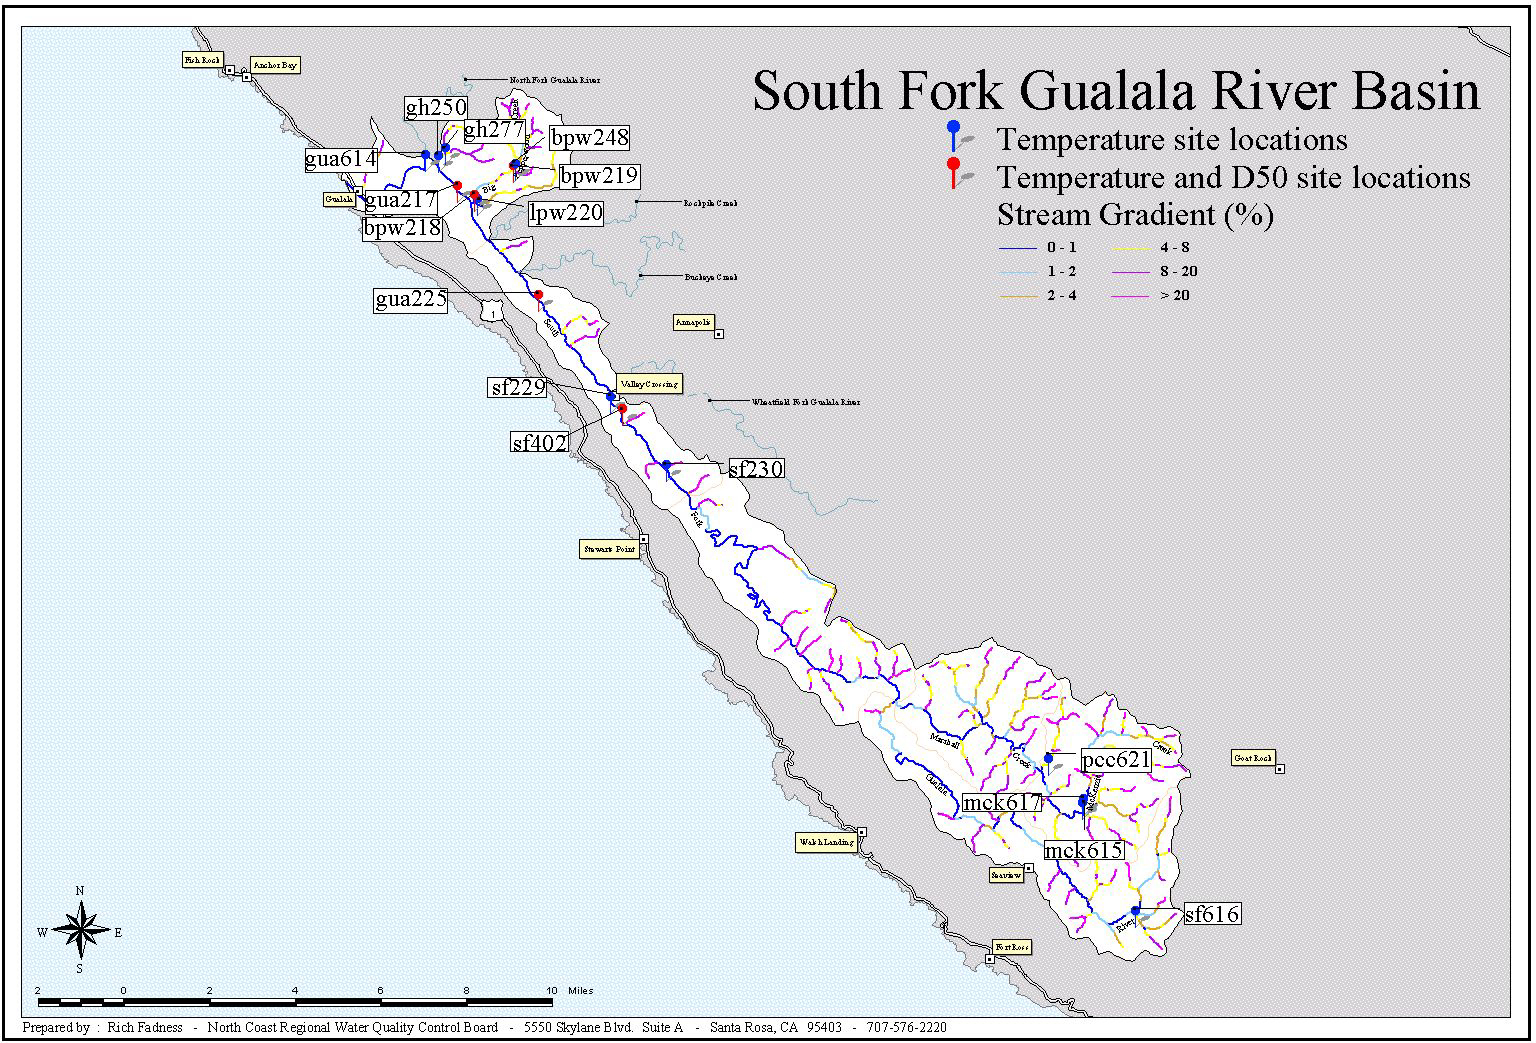