
| Area | Wheatfield |
| Topic | Temperature: Maximum Floating Weekly Average (F) Wheatfield 1995-2001 |
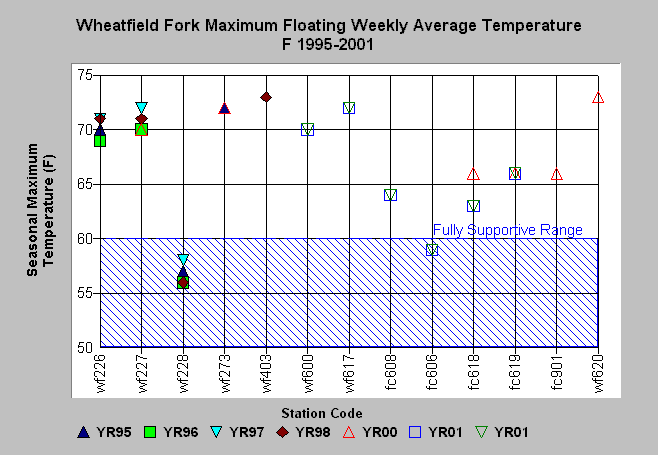
| Caption: The chart above shows the seasonal maximum of the floating weekly average water temperature (MWAT) derived from automated temperature probes placed in the Wheatfield basin, including Fuller Creek (fc), from 1994 to 2001. Readings indicate that the Fuller Creek station fc606 and the Wheatfield station wf228 are were both within the fully supportive range for salmonids, while all other sites were over optimal temperatures for salmonid rearing and above the range known to support coho salmon juveniles, which is 62.25 F (Welsh et al., 2001). See Info Links for more information. Data provided by Gualala Redwoods, Inc. and the Gualala River Watershed Council. | |
 |
To learn more about this topic click Info Links .
To view a table of information about this data click Metadata .
To view the table with the chart's data, click Chart Table web page.
To download the table with the chart's data, click wfmwatf.dbf (size 1,058 bytes) .
| www.krisweb.com |