
| Area | Wheatfield |
| Topic | Temperature: Seasonal Maxima for Wheatfield Sites Fahrenheit 1995-2001 |
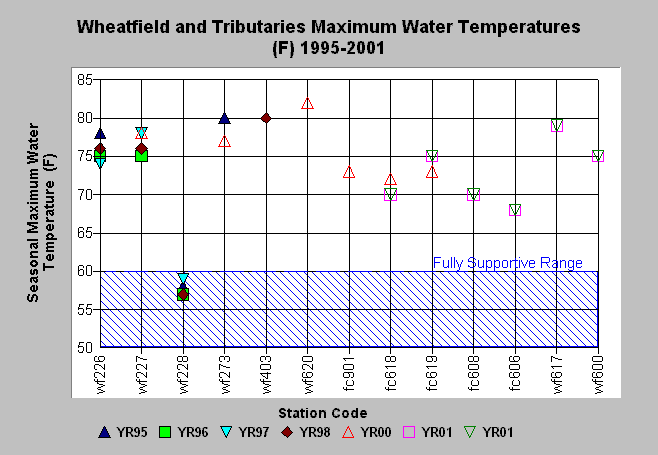
| Caption: The chart above shows the seasonal maximum water temperature derived from automated temperature probes placed in the Wheatfield basin, including Fuller Creek (fc), from 1994 to 2001. Readings indicate that the Wheatfield station wf228 was always within the fully supportive range for salmonids. Other stations registered moderately to acutely stressful or lethal temperature values. One time maximum temperatures do not provide information on duration of stress and so are less useful than MWAT for gauging suitability for salmonids. See Info Links for more information. Data provided by Gualala Redwoods, Inc. and the Gualala River Watershed Council. | |
 |
To learn more about this topic click Info Links .
To view a table of information about this data click Metadata .
To view the table with the chart's data, click Chart Table web page.
To download the table with the chart's data, click wfmaxf.dbf (size 1,058 bytes) .
| www.krisweb.com |