Photo Pages. Photos on this page are from sub-basin Jacoby Creek
and series Data Charts: Upper Jacoby Creek (UJC) Turbidity Threshold Sampling Results.
Click on any thumbnail to see a larger photo.
For detailed information on these photos click here.
19 KB
This chart is part of a series showing data results from the turbidity threshold salmpling station on Upper Jacoby Creek, operated by Redwood Sciences Lab (U.S. Forest Service). The chart shows a summary of the results from hydrologic year 2001, including discharge, turbidity, suspended sediment concentration (SSC), and annual loading estimate.
13 KB
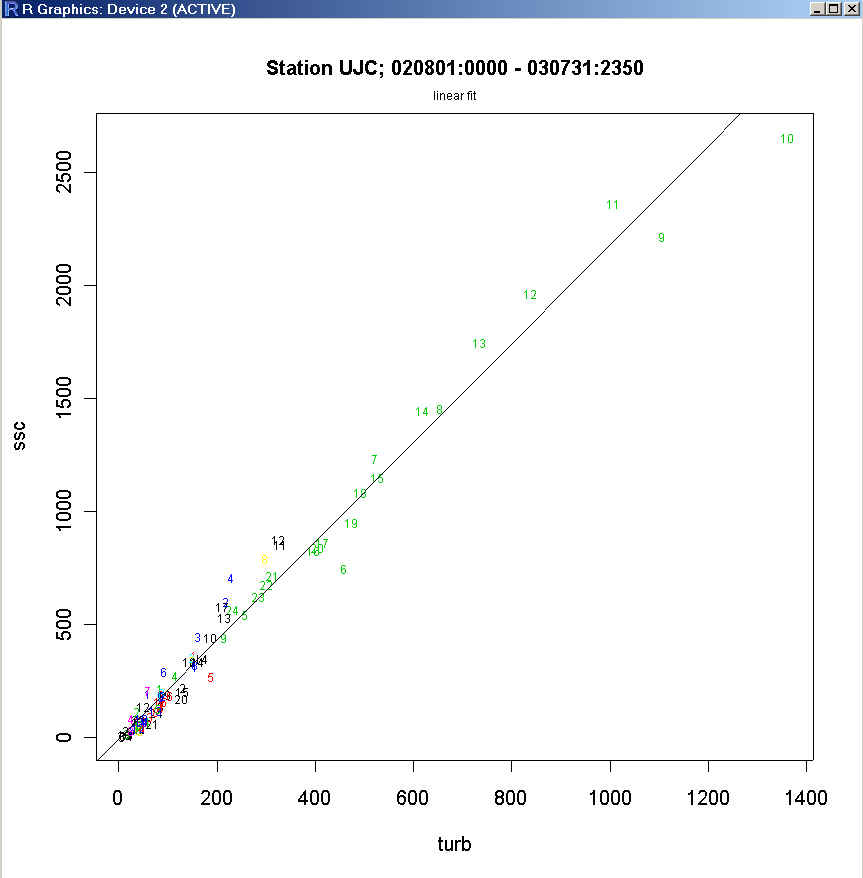
This chart is part of a series showing data results from the turbidity threshold salmpling station on Upper Jacoby Creek, operated by Redwood Sciences Lab (U.S. Forest Service). The chart shows the relationship between turbidity and suspended sediment concentration (SSC) for hydrologic year 2001, and the curve fit to the data.
20 KB
This chart is part of a series showing data results from the turbidity threshold salmpling station on Upper Jacoby Creek, operated by Redwood Sciences Lab (U.S. Forest Service). The chart shows a summary of the results from hydrologic year 2003, including discharge, turbidity, suspended sediment concentration (SSC), and annual loading estimate.
44 KB
This chart is part of a series showing data results from the turbidity threshold salmpling station on Upper Jacoby Creek, operated by Redwood Sciences Lab (U.S. Forest Service). The chart shows the relationship between turbidity and suspended sediment concentration (SSC) for hydrologic year 2003, and the curve fit to the data.
 13 KB
13 KB
 20 KB
20 KB
 44 KB
44 KB