| Area | Basin-wide/Regional |
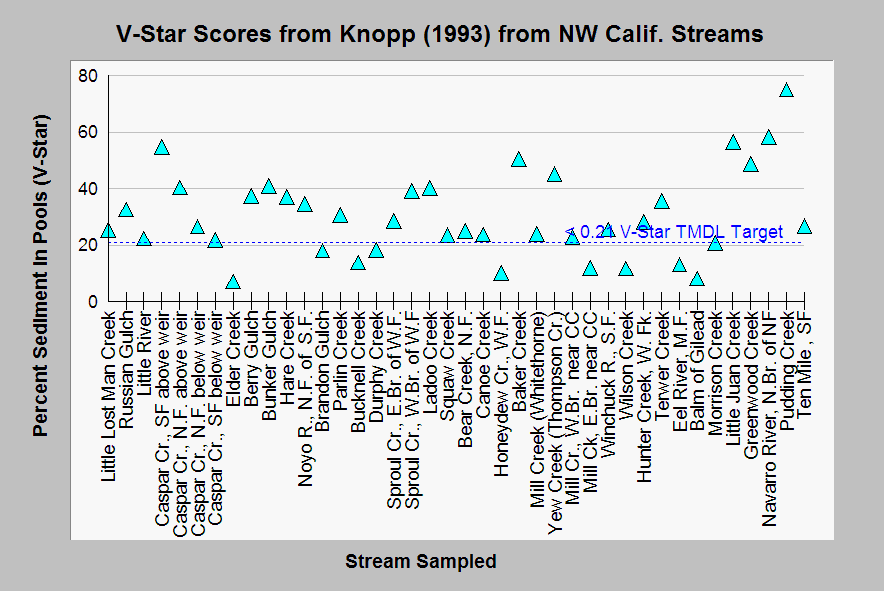
| Topic | Sediment: V-Star Scatter Plot for Knopp 1992-1993 |
| Caption: This chart shows all data from Knopp (1992) for volume of sediment in pools or V-Star for 60 locations throughout northwestern California. He found that diminished pool volumes could be correlated with land disturbance. If you are using a desk top version of KRIS, use the scroll bar at right to see values for more locations. See Info Links for more information on use of V-Star for understanding aquatic health for salmonids. Data provided by the North Coast Regional Water Quality Control Board. | |
 |
To learn more about this topic click Info Links .
To view additional information (data source, aquisition date etc.) about this page, click Metadata .
To view the table with the chart's data, click Chart Table web page.
To download the table with the chart's data, click knopp.dbf (size 12,582 bytes)
To download the table with the chart's data as an Excel spreadsheet, click knopp.dbf.xls (size 25,789 bytes) .
| www.krisweb.com |
