| Area |
Basin-wide/Regional |
| Topic |
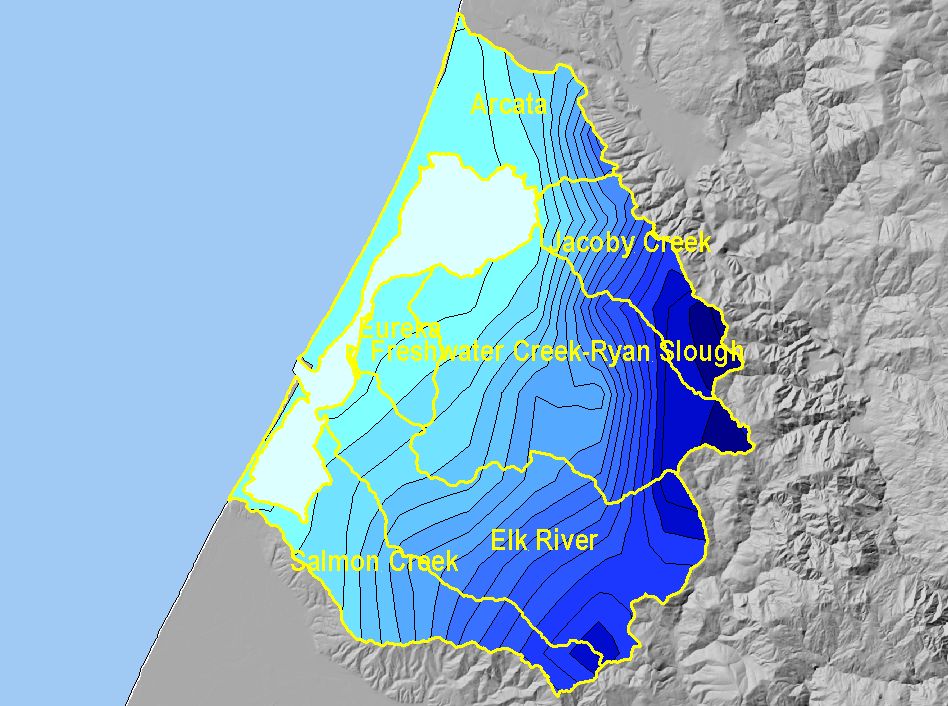
Map: E. Rainfall, Humboldt Bay |
To view a more detailed version of this map click
here
|
This is a map of mean annual precipitation in the Humboldt Bay Basin, based on a computer model by the Spatial Climate Analysis Service at Oregon State University,
displayed along with sub-basins and coastline. The model is based on 1961-1990 rainfall data. Higher rainfall occurs at higher inland elevations than at coastal lower
elevations.
|
|
|
 |
 |
To view metadata about a map layer, click on a link in the table below.
If you obtain KRIS on a CD and install it on your hard drive as a desktop program, you will have access to increased map capabilities such as zooming in/out, turning layers on/off, adding layers and changing legends.
