
| Area | Jacoby Creek |
| Topic | Sediment: Stage-Discharge at Upper Jacoby Cr 2002 |
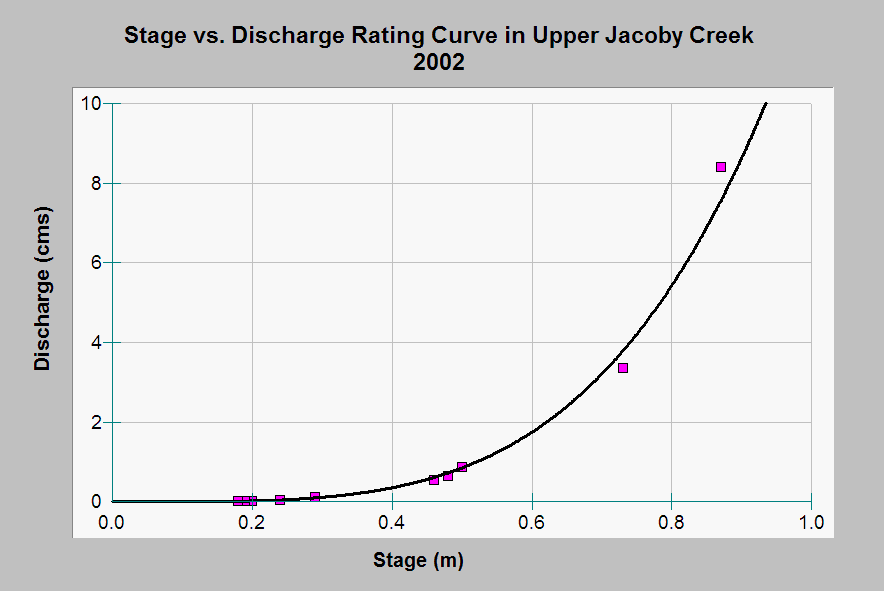
| Caption: This chart shows the stage-discharge rating curve for upper Jacoby Creek, from an Excel spreadsheet dated 1/10/2002. Data are from Redwood Science Lab (RSL). Dates for individual measurements are unknown. The power function curve shown here is for illustration purposes only and may not be exactly the same as the curve used by RSL [Q = 13.084 stage^3.9429, R^2 = 0.9965]. See Info Links for more information. | |
 |
To learn more about this topic click Info Links .
To view additional information (data source, aquisition date etc.) about this page, click Metadata .
To view the table with the chart's data, click Chart Table web page.
To download the table with the chart's data, click sed_stagedischarge_rsl_ujc_2002.db (size 18,432 bytes)
To download the table with the chart's data as an Excel spreadsheet, click sed_stagedischarge_rsl_ujc_2002.db.xls (size 3,584 bytes) .
| www.krisweb.com |