
| Area | Jacoby Creek |
| Topic | Sediment: Suspended Sed. vs. Turbidity at Upr Jacoby Cr (UJC) 2003 |
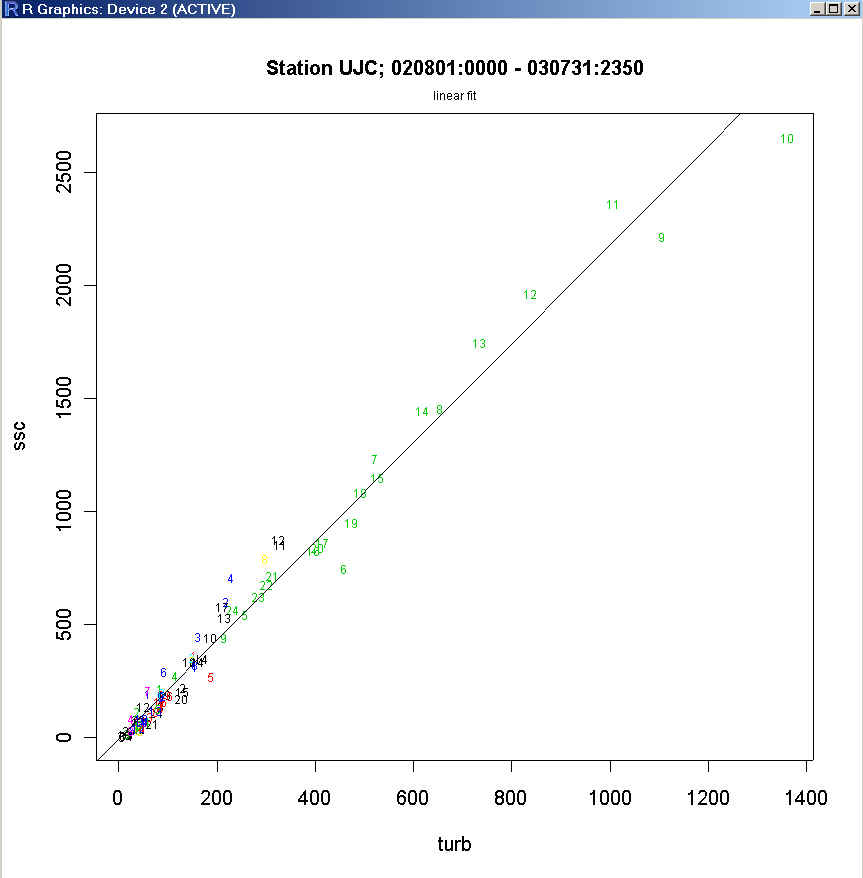
This chart is part of a series showing data results from the turbidity threshold sampling station on Upper Jacoby Creek, operated by Redwood Sciences Lab (U.S. Forest Service). The chart shows the relationship between turbidity and suspended sediment concentration (SSC) for hydrologic year 2003, and the curve fit to the data.
This chart is part of a series showing data results from the turbidity threshold sampling station on Upper Jacoby Creek, operated by Redwood Sciences Lab (U.S. Forest Service). The chart shows a summary of the results from hydrologic year 2003, including discharge, turbidity, suspended sediment concentration (SSC), and annual loading estimate.
 Click on image to enlarge (45K).
 Click on image to enlarge (21K).
To learn more about this topic click Info Links
To view additional information (data source, aquisition date etc.) about this page, click Metadata
| www.krisweb.com |