| Area | Middle Klamath |
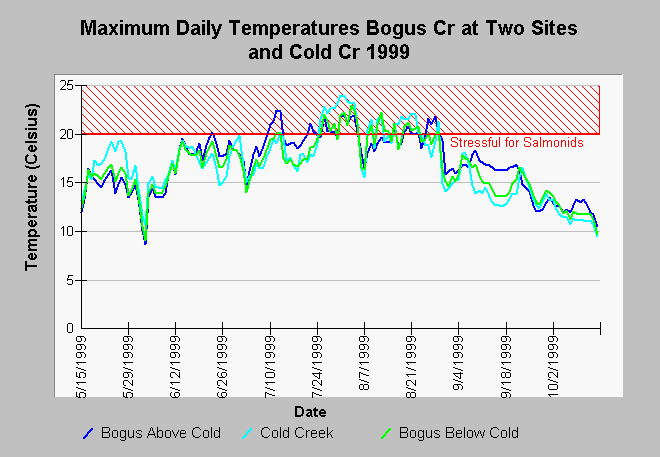
| Topic | Temperature: Maximum Daily Bogus Creek & Cold Creek 1999 |
| Caption: The chart above shows maximum daily water temperature of Bogus Creek above and below its confluence with Cold Creek and Cold Creek itself during the summer of 1999. Cold Creek shows a much different temperature pattern in 1999 versus 1996. Formerly Cold Creek was consistently colder than upper Bogus Creek. Data Collected by Bogus Elementary School using new Stow Away temperature probes. Road construction has resulted in reduced cover downstream of the confluence. | |
 |
To learn more about this topic click Info Links .
To view additional information (data source, aquisition date etc.) about this page, click Metadata .
To view the table with the chart's data, click Chart Table web page.
To download the table with the chart's data, click church.dbf (size 12,927 bytes) .
To view the table with the chart's source data, click Source Table web page.
To download the table with the chart's source data, click bogus99.dbf (size 2,686,668 bytes)
| www.krisweb.com |
