
| Area | Middle Klamath |
| Topic | Temperature: Min, Max, Avg Rock Creek 2002 |
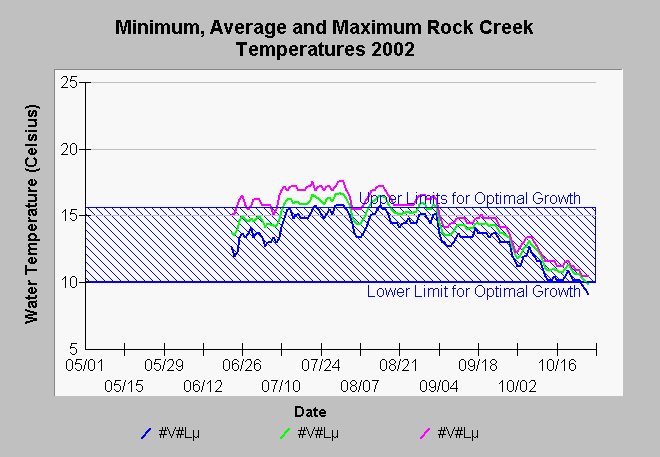
| Caption: This chart shows minimum, average, and maximum daily water temperature for lower Rock Creek for the year 2002. Maximum daily river temperatures sometimes slightly exceeded the optimal growth range, but minimums almost always dropped within it. Data were provided by the Klamath National Forest and the Karuk Tribe. See Info links for more information. | |
 |
To learn more about this topic click Info Links .
To view additional information (data source, aquisition date etc.) about this page, click Metadata .
To view the table with the chart's data, click Chart Table web page.
To download the table with the chart's data, click temp_md_orl_usfs_knf_97_02_daily.db (size 251,904 bytes) .
To view the table with the chart's source data, click Source Table web page.
To download the table with the chart's source data, click tempraw_klam_usfs_knf_97_02.db (size 18,581,504 bytes)
| www.krisweb.com |