
| Area | Salmon River |
| Topic | Temperature: Temp Max Little North Fork Bracket @ NF Salmon 2002 |
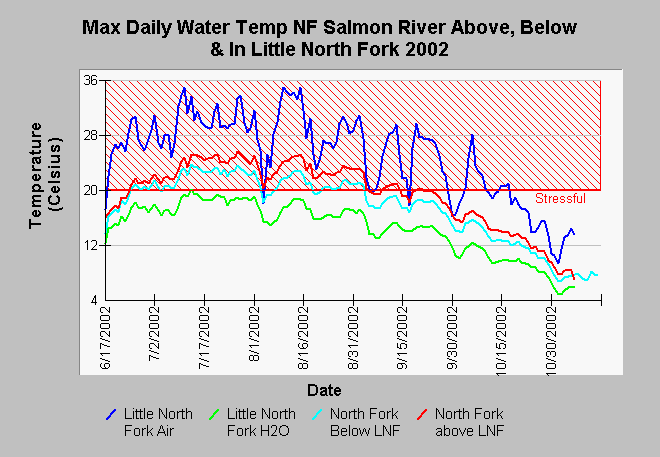
| Caption: This chart shows the maximum daily water temperatures during the summer of 2002 of the NF Salmon River above, below and in the Little North Fork and the air temperature at the mouth of the Little North Fork. Air temperature peaks and dips appear to correlate with the same periods of change in the water temperatures. Data were collected by automated temperature sensors called Hobotemps, which were anchored in flowing water in the shade between June and November 2002. Hobotemps were monitored by students at Sawyers Bar School and paid staff of the Salmon River Restoration Council. Click Picture* to see recent historical data. | |
 |
To learn more about this topic click Info Links .
To view additional information (data source, aquisition date etc.) about this page, click Metadata .
To view the table with the chart's data, click Chart Table web page.
To download the table with the chart's data, click lnfbrac02.db (size 18,432 bytes) .
To view the table with the chart's source data, click Source Table web page.
To download the table with the chart's source data, click sr9702.dbf (size 30,046,142 bytes)
| www.krisweb.com |