
| Area | Salmon River |
| Topic | Temperature: Temp Floating Weekly Max Methodist Creek 1997-2002 |
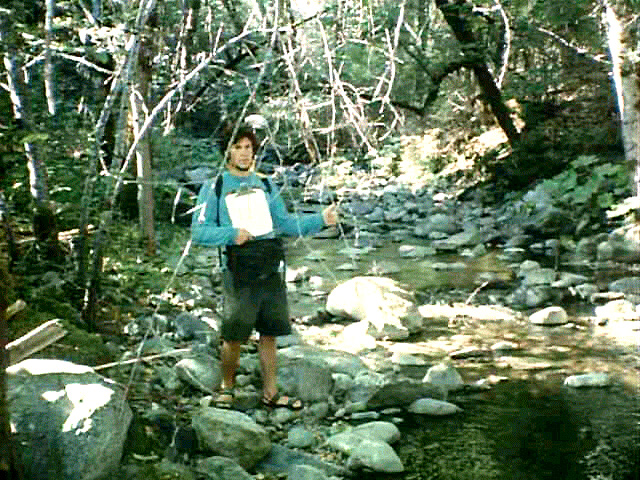
Methodist Creek, 1/4 mile up from the mouth of the creek, looking upstream, 1997
Methodist Creek, 1/4 mile up from the mouth of the creek, looking downstream, 1997
This chart shows maximum daily water temperatures in Methodist Creek during the summers of 1997, 1998, 1999, and 2000. Note that temperatures remained below the stressful level all four years, with the exception of a brief period in August 1997. Data were collected from automated temperature sensors called Hobotemps, which anchored in moving water in the shade. Hobotemps were monitored by students at the three river schools, community volunteers, and paid staff of the Salmon River Restoration Council.
This chart shows floating weekly maximum water temperatures in Methodist Creek during the summers of 1997, 1998, 1999, 2000 and 2001. Note that temperatures remained below the stressful level all five years. Data were collected from automated temperature sensors called Hobotemps, which anchored in moving water in the shade. Hobotemps were monitored by students at the three river schools, community volunteers, and paid staff of the Salmon River Restoration Council.
 Click on image to enlarge (293K).
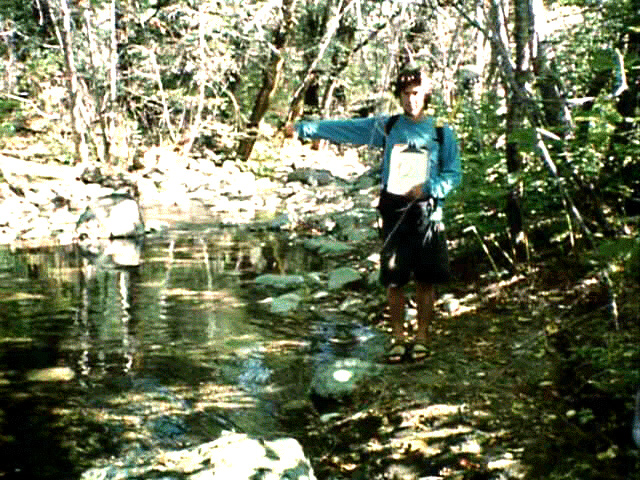 Click on image to enlarge (291K).
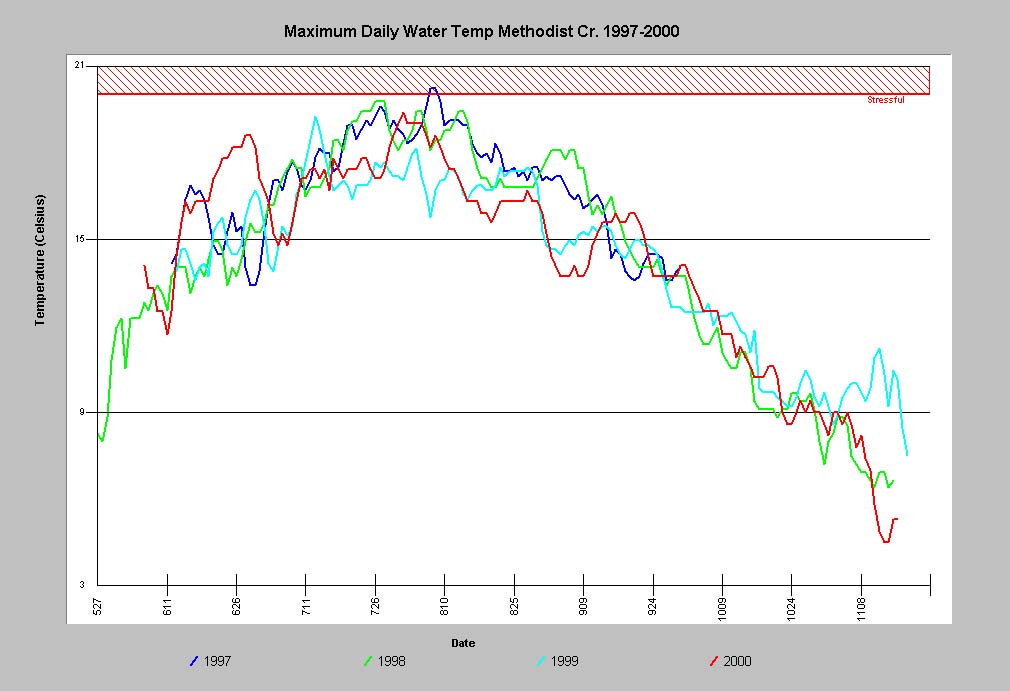 Click on image to enlarge (94K).
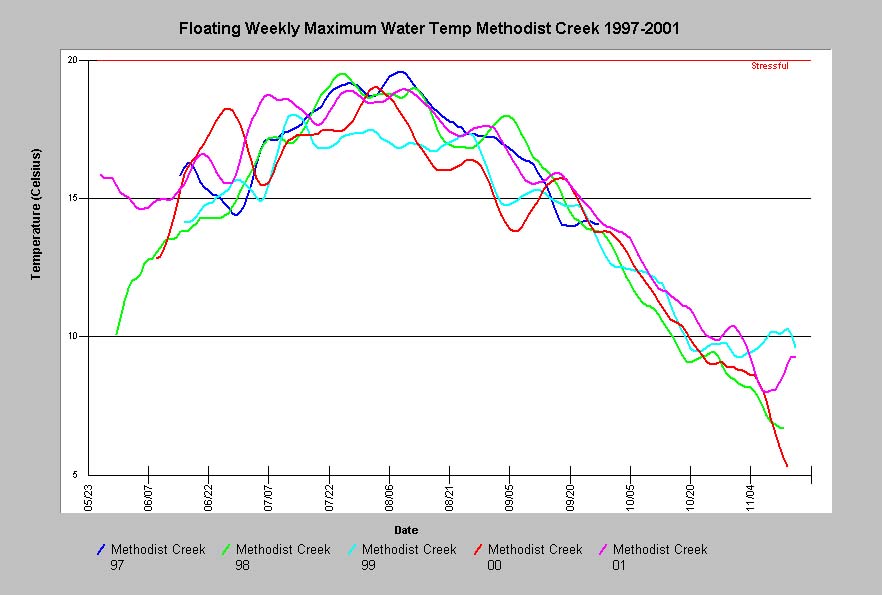 Click on image to enlarge (68K).
To learn more about this topic click Info Links
To view additional information (data source, aquisition date etc.) about this page, click Metadata
| www.krisweb.com |