
| Area | Salmon River |
| Topic | Temperature: Temp Floating Weekly Max Nordheimer Creek 1997-2002 |
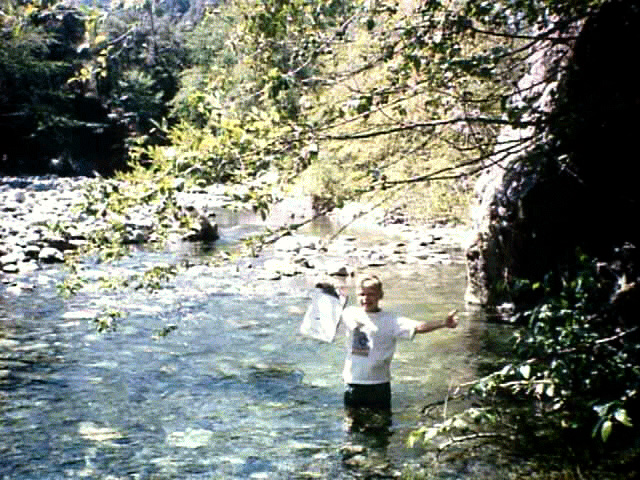
Nordheimer Creek, 400' upstream from its mouth, looking upstream, 1997
Nordheimer Creek, 400' upstream from its mouth, looking downstream, 1997
This chart shows maximum daily water temperatures in Nordheimer Creek during the summers of 1997, 1998, 1999, and 2000. Mainstem temperatures were critical in this reach from early July through mid September in 1997, 1998 and 2000. Data were collected from automated temperature sensors called Hobotemps, which anchored in moving water in the shade. Hobotemps were monitored by students at the three river schools, community volunteers, and paid staff of the Salmon River Restoration Council.
This chart shows floating maximum weekly water temperatures in Nordheimer Creek during the summers of 1997, 1998, 1999, 2000 and 2001. Temperatures were critical in this reach from early July through mid September in 1997, 1998, 2000 and 2001. Data were collected from automated temperature sensors called Hobotemps, which anchored in moving water in the shade. Hobotemps were monitored by students at the three river schools, community volunteers, and paid staff of the Salmon River Restoration Council. Click on Picture* to see photographs of Hobotemp sites.
 Click on image to enlarge (251K).
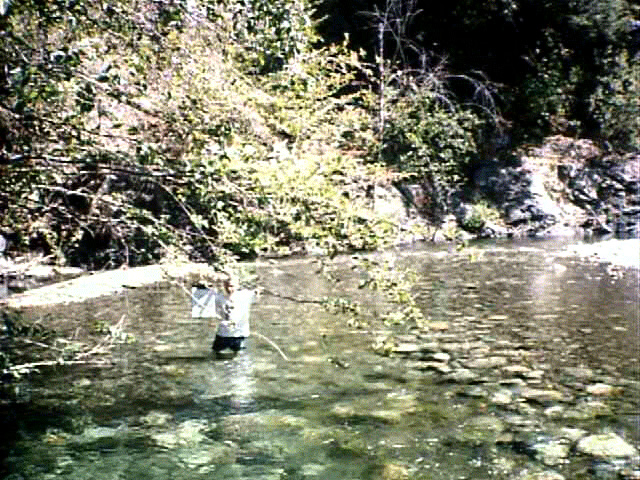 Click on image to enlarge (272K).
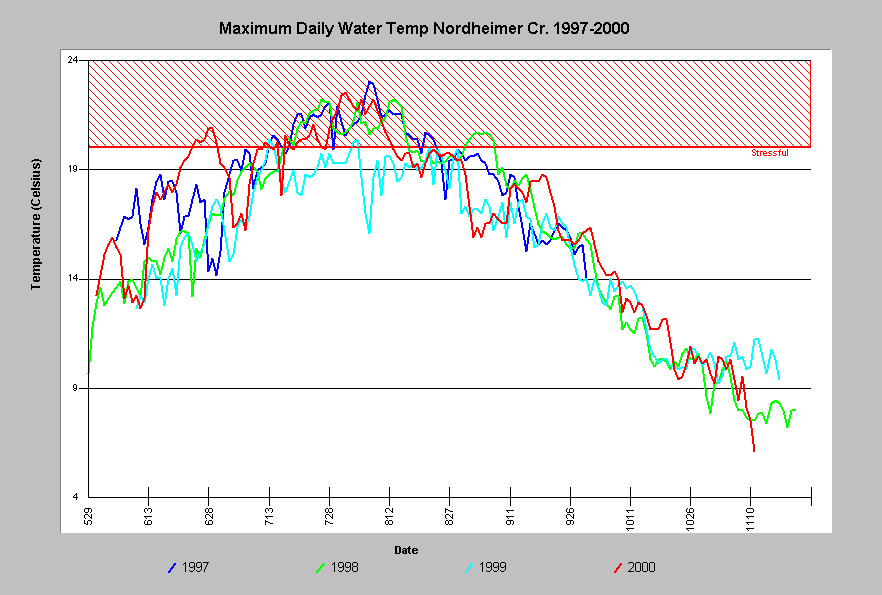 Click on image to enlarge (201K).
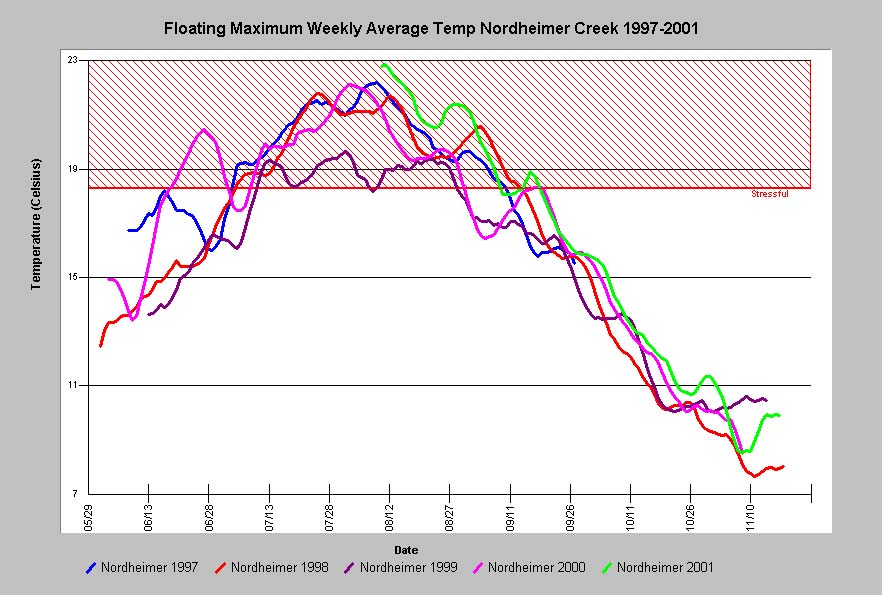 Click on image to enlarge (109K).
To learn more about this topic click Info Links
To view additional information (data source, aquisition date etc.) about this page, click Metadata
| www.krisweb.com |