
| Area | Salmon River |
| Topic | Temperature: Temp Max Black Bear Creek Bracket @ SF Salmon 1998 |
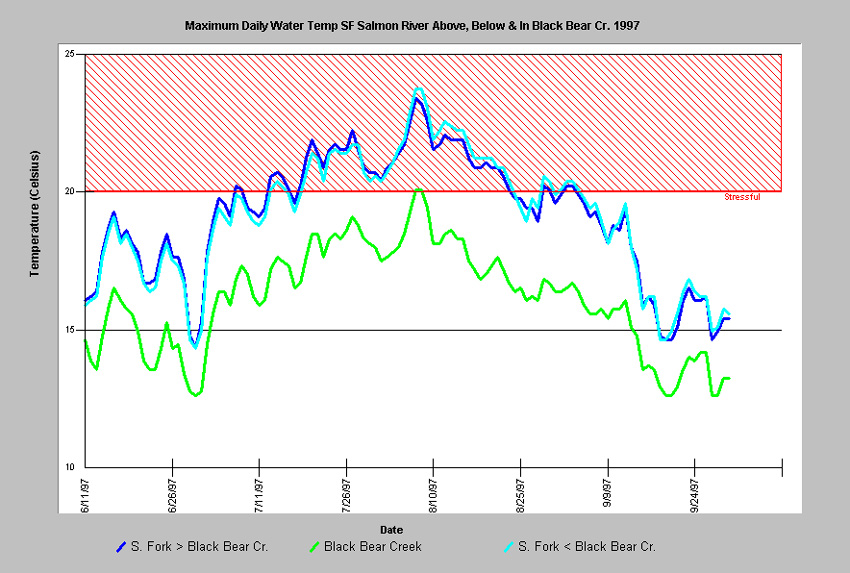
This chart shows the maximum daily water temperatures during the summer of 1997 in the SF Salmon River above, below and in Black Bear Creek. Notice that while Black Bear Creek was considerably cooler than the SF, it did not seem to have much of a cooling influence on the SF. This may suggest that Black Bear Creek is not large enough to noticeably affect the temperature of the SF. Black Bear Creek confluence with the SF did provide a cold water refugia for Salmonids during the heat of mid summer. This chart was derived from Chart Table MMBAX97.dbf. The data for Chart Table BBMAX97.dbf was filtered from Source Table SAUSF97.dbf. Data for that chart was collected from automated temperature sensors called Hobotemps, which were anchored in flowing water in the shade. Hobotemps were monitored by community volunteers and paid staff of the Salmon River Restoration Council.
400' up Black Bear Creek (off SF Salmon) Looking Upstream 1997
400' up Black Bear Creek (off SF Salmon) Looking Downstream 1997
SF Salmon 200' Above Black Bear Creek Looking Upstream 1997
SF Salmon 200' Above Black Bear Creek Looking Downstream 1997
 Click on image to enlarge (252K).
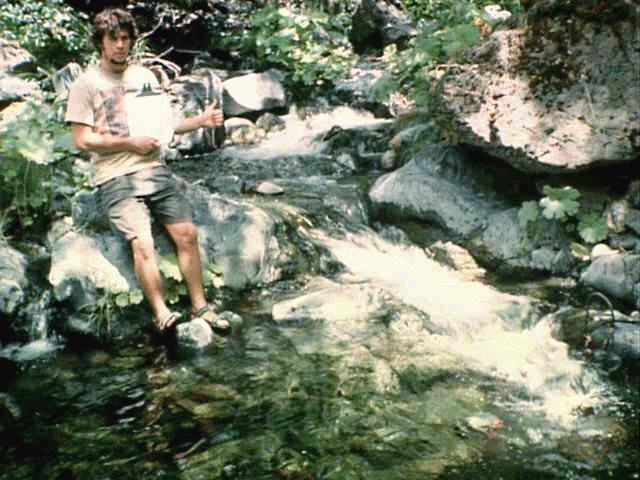 Click on image to enlarge (244K).
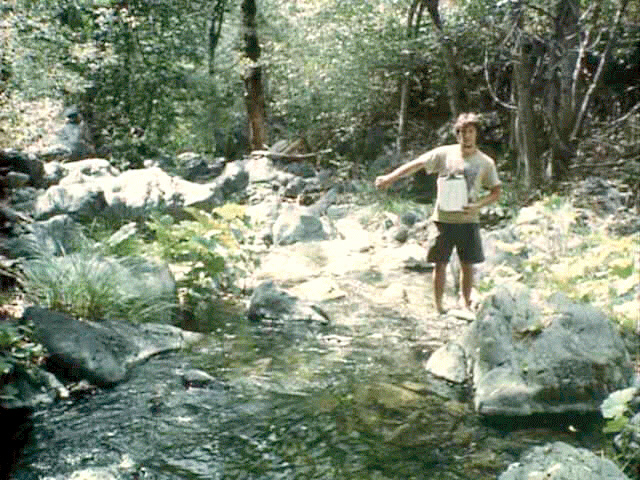 Click on image to enlarge (243K).
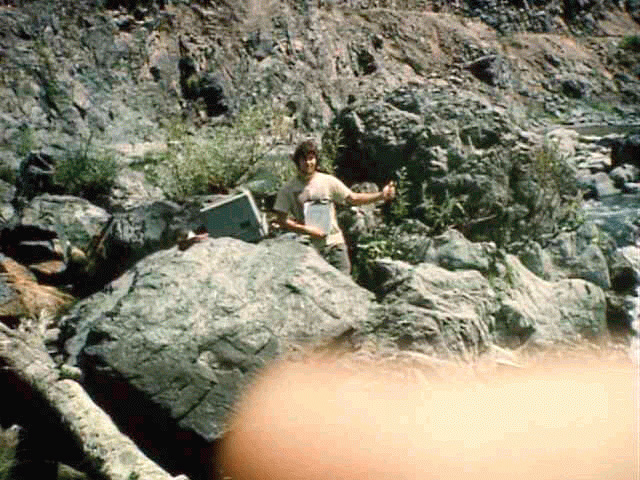 Click on image to enlarge (208K).
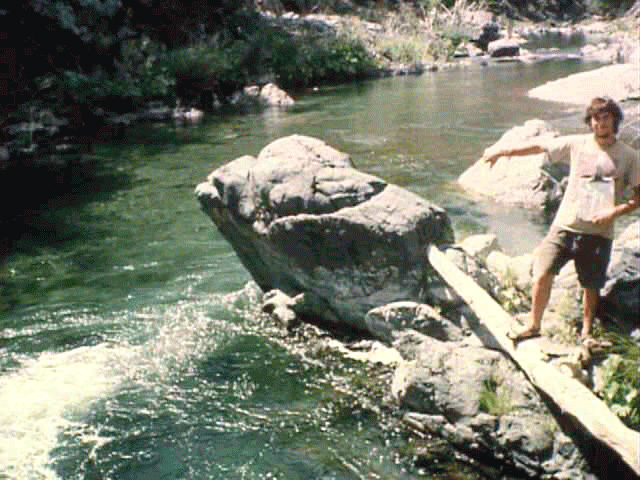 Click on image to enlarge (211K).
To learn more about this topic click Info Links
To view additional information (data source, aquisition date etc.) about this page, click Metadata
| www.krisweb.com |