
| Area | Salmon River |
| Topic | Temperature: Temp Max East Fork of SF & SF Salmon 2002 |
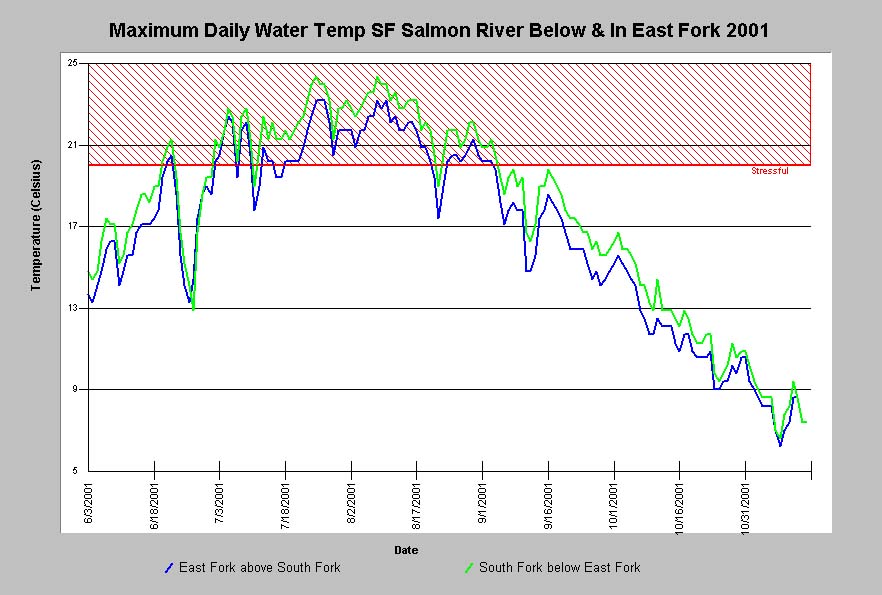
This chart shows the maximum daily water temperatures during the summer of 2001 in the EF Salmon River above its confluence with the SF and the SF Salmon River below the confluence. Note the cooler temperatures of the East Fork, which appear to have influenced slightly the temperature of the South Fork below the confluence. Notice that the East Fork appears to be cooler than the South Fork, although the temperatures reached stressful levels for Salmonids at both sites in July and August. Data were collected from automated temperature sensors called Hobotemps, which were anchored in flowing water in the shade. Hobotemps were monitored by community volunteers and paid staff of the Salmon River Restoration Council. Click on Picture* to see recent historical data.
This chart shows the maximum daily water temperatures during the summer of 2000 in the EF Salmon River above its confluence with the SF and the SF Salmon River below the confluence. Note the cooler temperatures of the East Fork, which appear to have influenced slightly the temperature of the South Fork below the confluence. Notice that the East Fork appears to be cooler than the South Fork, although the temperatures reached stressful levels for Salmonids at both sites in late July/early August. The data gap on the South Fork in July/August was caused by a temperature sensor being out of the water. Data were collected from automated temperature sensors called Hobotemps, which were anchored in flowing water in the shade. Hobotemps were monitored by community volunteers and paid staff of the Salmon River Restoration Council. Click on Picture* to see recent historical data.
This chart shows the maximum daily water temperatures during the summer of 1999 in the SF Salmon River above, below and in the East Fork. Note the cooler temperatures of the East Fork, which appear to have influenced slightly the temperature of the SF Salmon below the confluence. The temperatures remained below the level stressful for Salmonids during the bulk of the summer heat, with only a few temperature spikes in July and August in the SF above its confluence with the East Fork. Data were collected from automated temperature sensors called Hobotemps, which were anchored in flowing water in the shade. Hobotemps were monitored by community volunteers and paid staff of the Salmon River Restoration Council. Chart was derived from Chart Table EFMAX99.dbf, which was filtered from Source Table Salmon99.dbf.
This chart shows the maximum daily water temperatures during the summer of 1991 in the East Fork above its confluence with the SF Salmon and in the SF Salmon below the confluence. Notice that the East Fork and the SF Salmon had very similar maximum daily water temperature patterns in 1991. This chart was derived from Chart Table samaxdd.dbf. That data were collected from automated temperature sensors called Hobotemps, which were anchored in flowing water in the shade. Hobotemps were provided and monitored by the U.S. Forest Service, Salmon River Ranger District. Data were assimilated by Tim Mahan on behalf of the North Coast Regional Water Quality Control Board and provided to KRIS staff.
 Click on image to enlarge (99K).
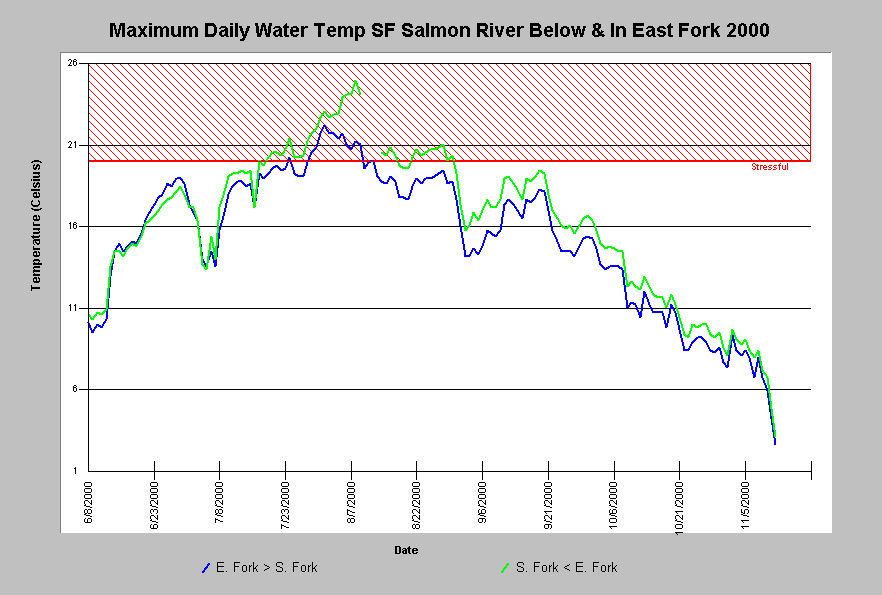 Click on image to enlarge (178K).
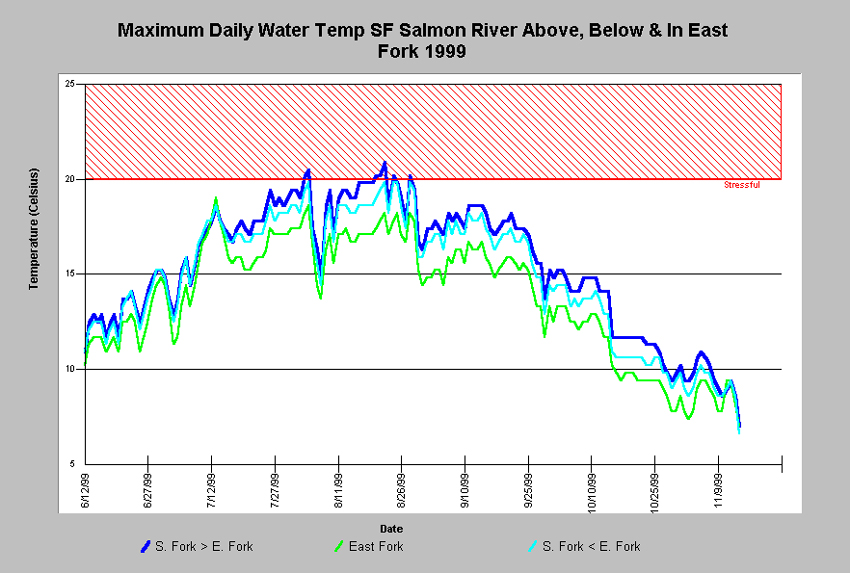 Click on image to enlarge (338K).
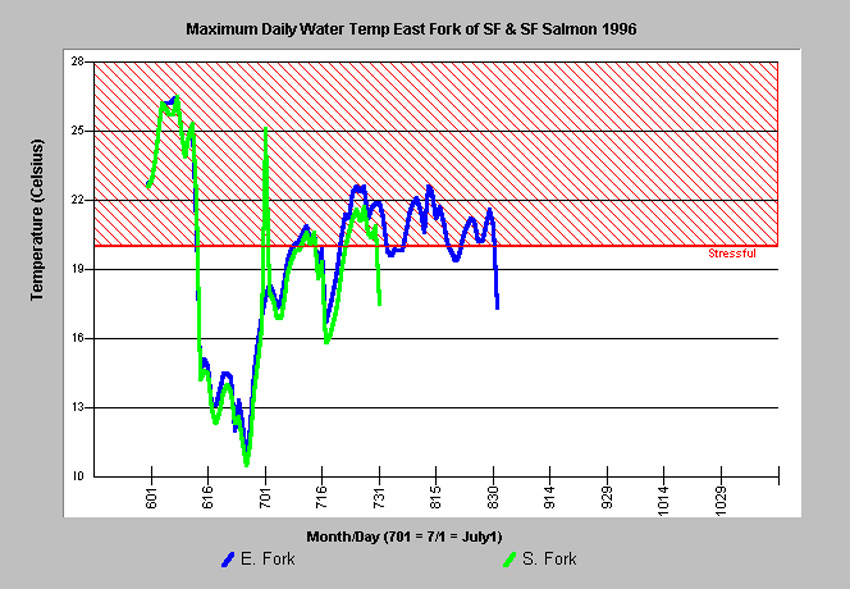 Click on image to enlarge (281K).
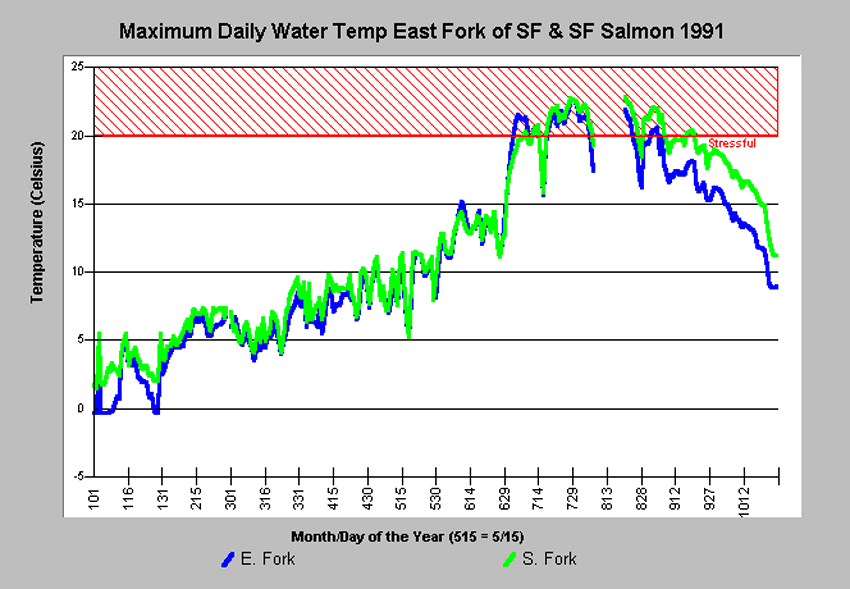 Click on image to enlarge (302K).
To learn more about this topic click Info Links
To view additional information (data source, aquisition date etc.) about this page, click Metadata
| www.krisweb.com |