
| Area | Salmon River |
| Topic | Temperature: Temp Max Indian Creek Bracket @ SF Salmon 1998 |
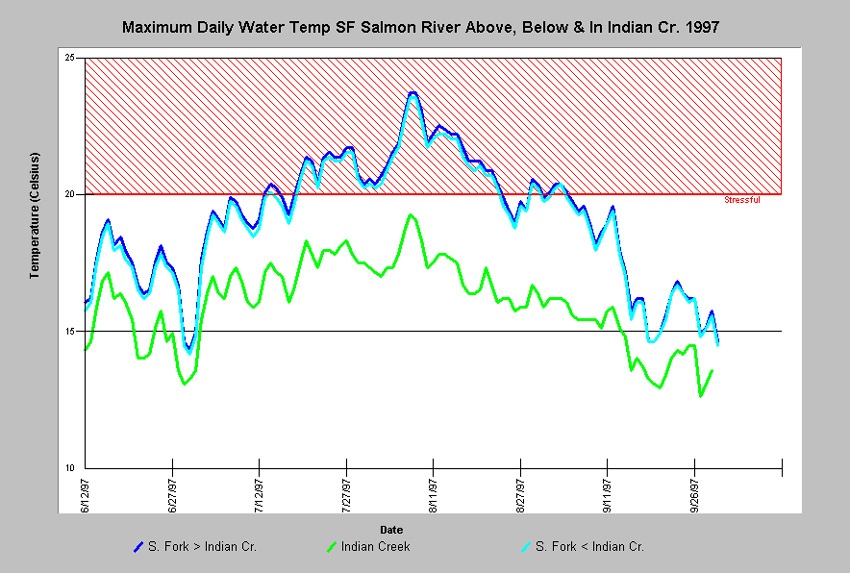
This chart shows maximum daily water temperatures during the summer of 1997 of the SF Salmon River above, below and in Indian Creek. Notice that Indian Creek was noticeably cooler than the SF Salmon but that it did not appear to have a significant cooling influence on the SF Salmon. This may suggest that Indian Creek was not of sufficient size to significantly impact the temperature of the SF. The mouth of Indian Creek did provide a cold water refugia for Salmonids during the summer temperature peak. This chart was derived from Chart Table InMax97.dbf, which was derived from Source Table sain97.dbf. That table contains water temperature data collected by automated temperature sensors called Hobotemps, which were anchored in flowing water in the shade, recording temperatures between June 5 and September 30, 1997. Hobotemps were monitored by community volunteers and paid staff of the Salmon River Restoration Council.
SF Salmon 1/2 Mile above Methodist Creek Looking Upstream 1997
SF Salmon 1/2 Mile above Methodist Creek Looking Downstream 1997
500' up Indian Creek (off SF Salmon) Looking Upstream 1997
500' up Indian Creek (off SF Salmon) Looking Downstream 1997
SF Salmon 300' above Indian Creek Looking Upstream 1997
SF Salmon 300' above Indian Creek Looking Downstream 1997
 Click on image to enlarge (251K).
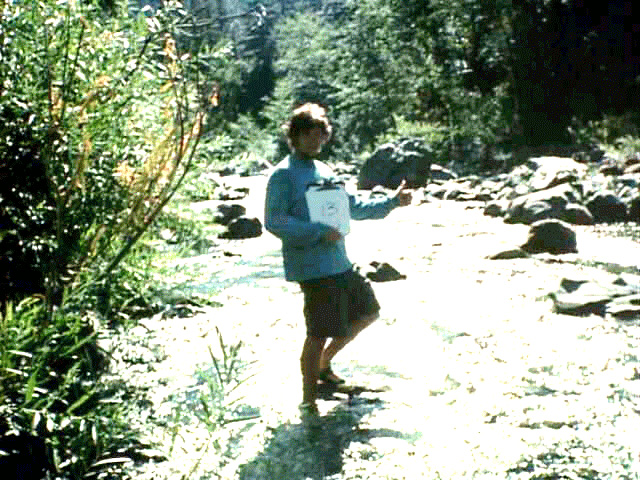 Click on image to enlarge (239K).
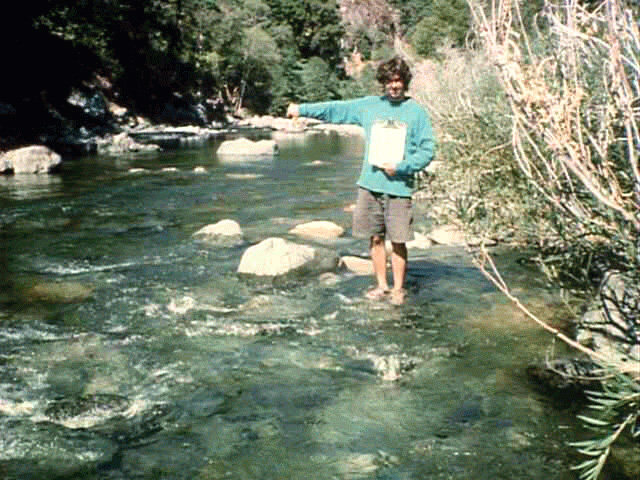 Click on image to enlarge (222K).
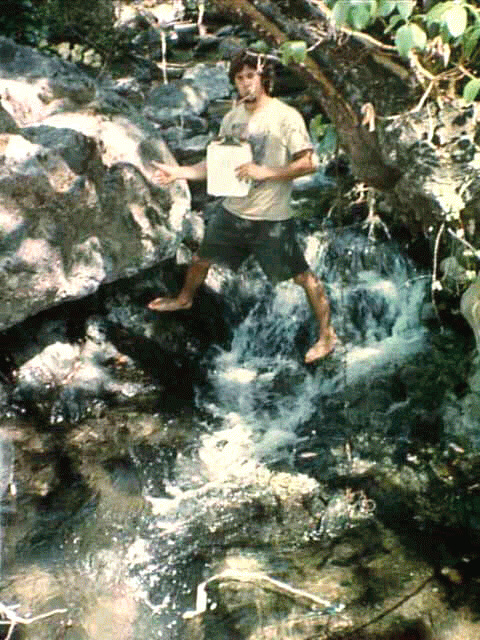 Click on image to enlarge (234K).
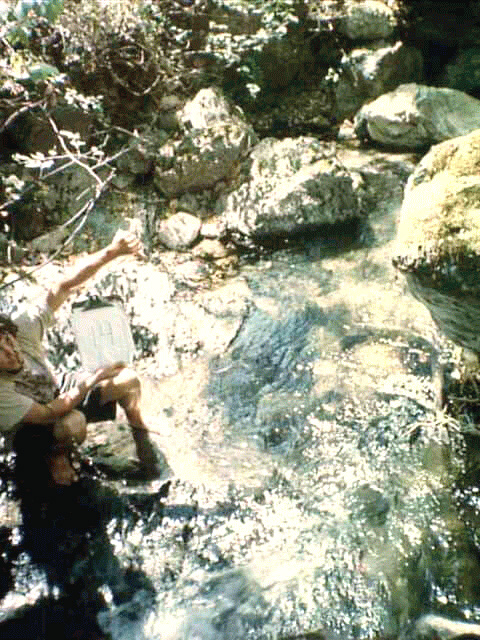 Click on image to enlarge (243K).
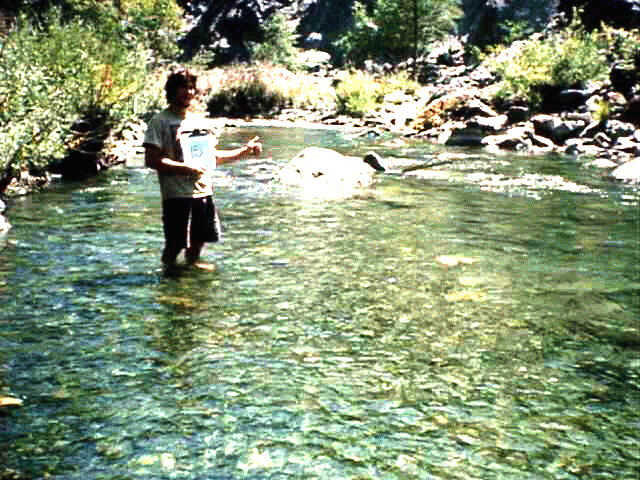 Click on image to enlarge (335K).
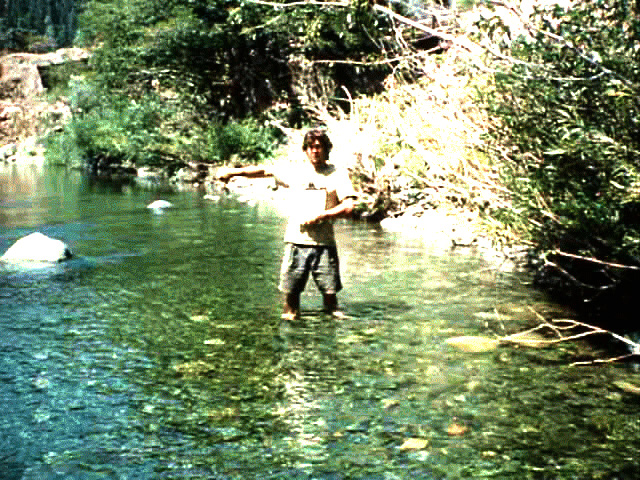 Click on image to enlarge (316K).
To learn more about this topic click Info Links
To view additional information (data source, aquisition date etc.) about this page, click Metadata
| www.krisweb.com |