
| Area | Salmon River |
| Topic | Temperature: Temp Max Little North Fork Bracket @ NF Salmon 2002 |
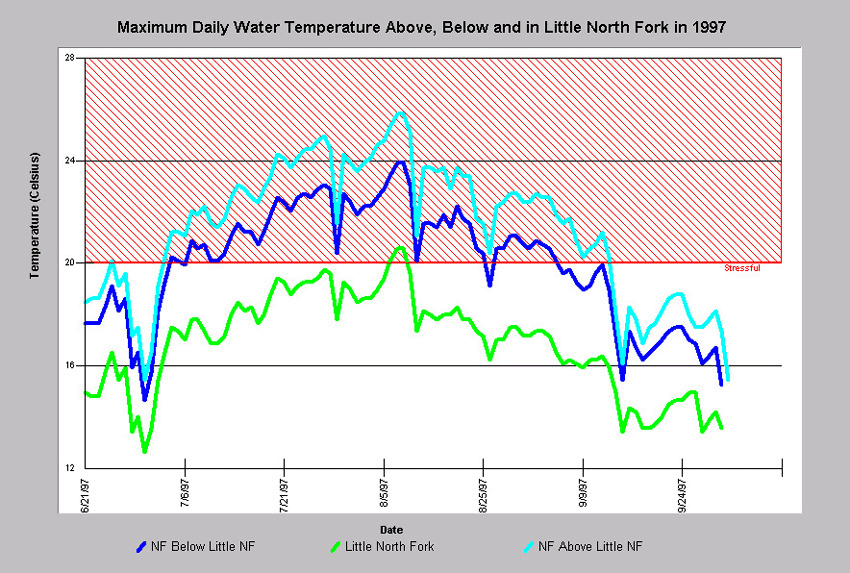
This chart shows the maximum daily water temperatures during the summer of 1997 of the NF Salmon River below, above and in the Little North Fork. Except for one peak mid summer, the water temperatures in the Little North Fork remained below levels stressful for Salmonids. The water temperature in the NF Salmon, however, remained above levels stressful for Salmonids from July to September. Notice that the water temperature of the NF Salmon below its confluence with the Little North Fork was significantly cooler than above the confluence. This suggests that the Little North Fork provided enough cold water to the NF Salmon this year to lower the river temperature during stressful times. Data were collected by automated temperature sensors called Hobotemps, which were anchored in flowing water in the shade between June and September 1997. Hobotemps were monitored by students at Sawyers Bar School and paid staff of the Salmon River Restoration Council. Click Pictures* to see more recent historical data.
This chart shows the maximum daily water temperature during summer of 1998 of the NF Salmon River below, above and in Little North Fork. Note that temperatures became stressful for Salmonids in the NF Salmon and not in the Little North Fork and that the water temperature in the NF Salmon below its confluence with the Little North Fork was significantly cooler than above the confluence. This suggests that the Little North Fork provided enough cold water to the NF Salmon to lower the temperature of the NF during stressful times. Data were collected by automated temperature sensors called Hobotemps, which were anchored in flowing water in the shade between May and November 1998. Hobotemps were monitored by students at Sawyers Bar School and paid staff of the Salmon River Restoration Council.
This chart shows the maximum daily water temperatures during the summer of 1999 of the NF Salmon River above, below and in the Little North Fork and the air temperature at the Little North Fork. Notice that the water temperatures in the NF Salmon River reached levels stressful to Salmonids during mid summer. The Little North Fork this year did not seem to influence the water temperature in the NF Salmon during mid summer. From late August on, however, the Little North Fork did seem have a cooling effect on the NF Salmon. This was probably due to the volume relationships. Air temperature peaks and dips appear to correlate with the same periods of change in the water temperatures. Data gaps for water temperature in the Little North Fork in early July and for air temperature in June and July were due to malfunctioning temperature sensors. Data were collected by automated temperature sensors called Hobotemps, which were anchored in flowing water in the shade between May and November 1999. Hobotemps were monitored by students at Sawyers Bar School and paid staff of the Salmon River Restoration Council. This chart was derived from Chart Tale LNFMax99.dbf, which was filtered from Source Table Salmon99.dbf.
This chart shows the maximum daily water temperatures during the summer of 2000 of the NF Salmon River above, below and in the Little North Fork and the air temperature at the Little North Fork. The data gaps on the NF above the Little North Fork were due to a faulty temperature sensor. Air temperature peaks and dips appear to correlate with the same periods of change in the water temperatures. Data were collected by automated temperature sensors called Hobotemps, which were anchored in flowing water in the shade between May and November 2000. Hobotemps were monitored by students at Sawyers Bar School and paid staff of the Salmon River Restoration Council.
This chart shows the maximum daily water temperatures during the summer of 2001 of the NF Salmon River above, below and in the Little North Fork and the air temperature at the Little North Fork. The data gaps on the NF above and below the Little North Fork were due to technical difficulties. Air temperature peaks and dips appear to correlate with the same periods of change in the water temperatures. Data were collected by automated temperature sensors called Hobotemps, which were anchored in flowing water in the shade between May and November 2001. Hobotemps were monitored by students at Sawyers Bar School and paid staff of the Salmon River Restoration Council. Click Picture* to see recent historical data.
 Click on image to enlarge (517K).
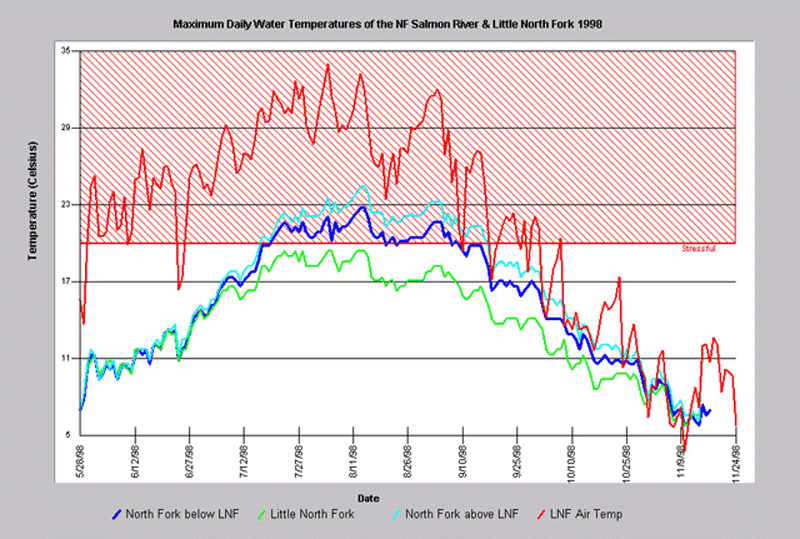 Click on image to enlarge (494K).
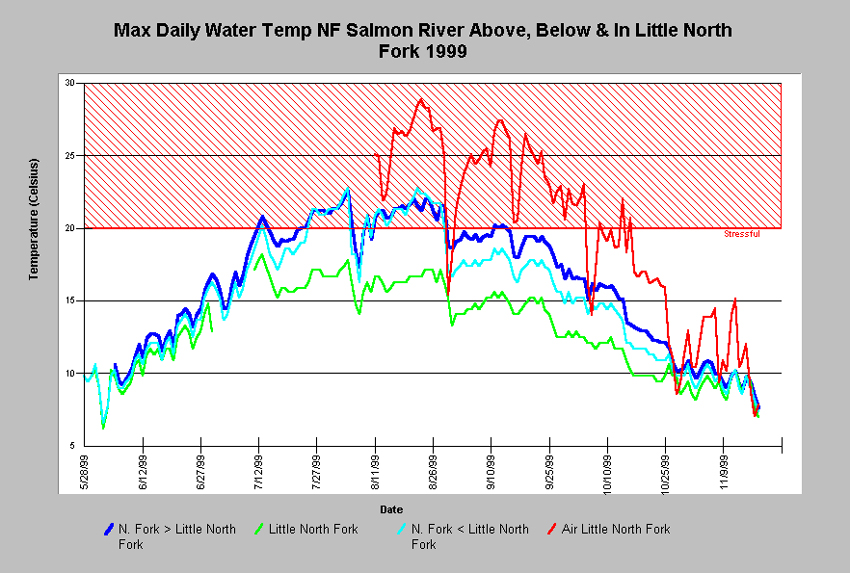 Click on image to enlarge (424K).
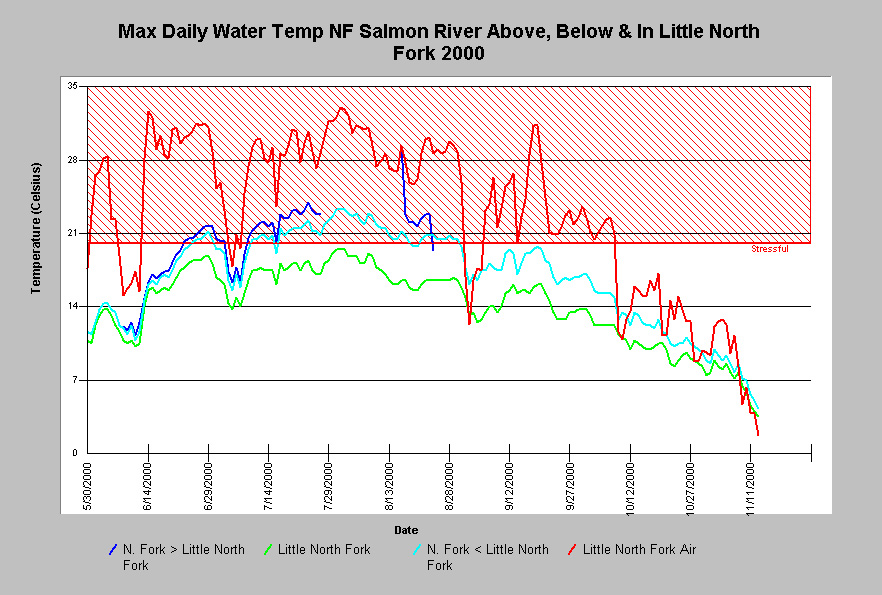 Click on image to enlarge (257K).
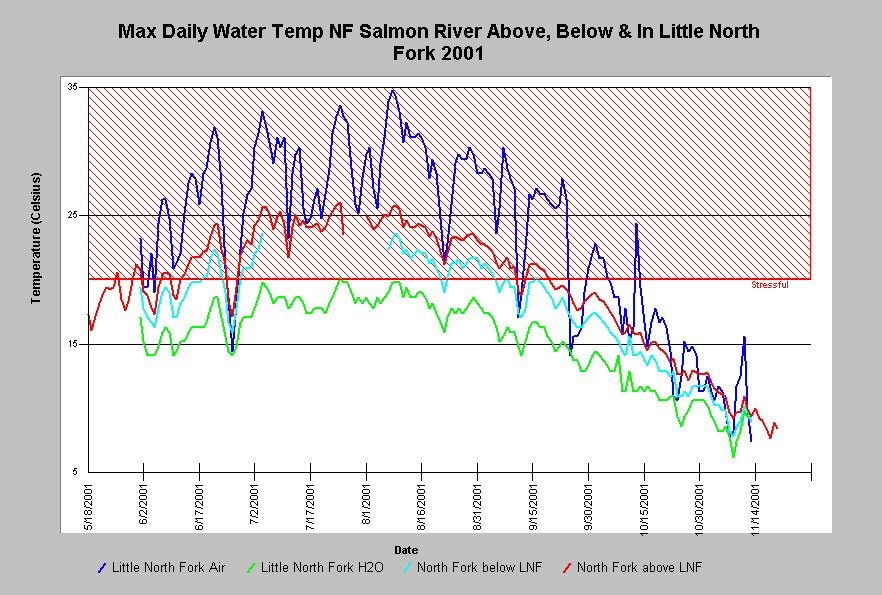 Click on image to enlarge (289K).
To learn more about this topic click Info Links
To view additional information (data source, aquisition date etc.) about this page, click Metadata
| www.krisweb.com |