
| Area | Salmon River |
| Topic | Temperature: Temp Max NF, SF and Mainstem @ Confluence 2002 |
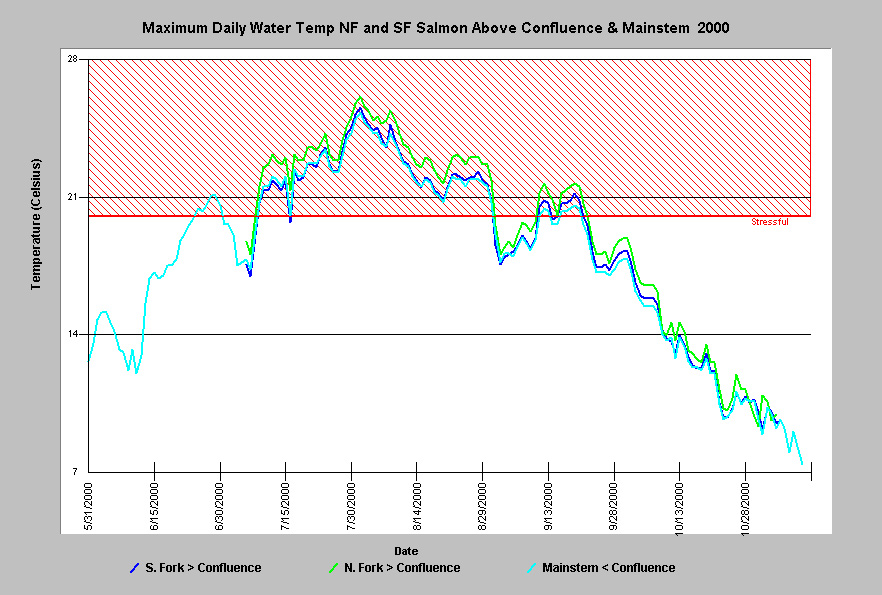
This chart shows the maximum daily water temperatures during summer of 2000 of the NF Salmon and SF Salmon above their confluence and the mainstem and below their confluence. Notice that during July and August all three locations were in the temperature range stressful to salmonids. Data were collected by automated temperature sensors called Hobotemps, which were anchored in flowing water in the shade. Hobotemps were monitored by community volunteers, paid staff of the Salmon River Restoration Council, and the USFS.
This chart shows the maximum daily water temperatures during summer of 2001 of the NF Salmon and SF Salmon above their confluence and the mainstem and below their confluence. Notice that during July and August all three locations were in the temperature range stressful to salmonids. Data were collected by automated temperature sensors called Hobotemps, which were anchored in flowing water in the shade. Hobotemps were monitored by community volunteers, paid staff of the Salmon River Restoration Council, and the USFS.
 Click on image to enlarge (223K).
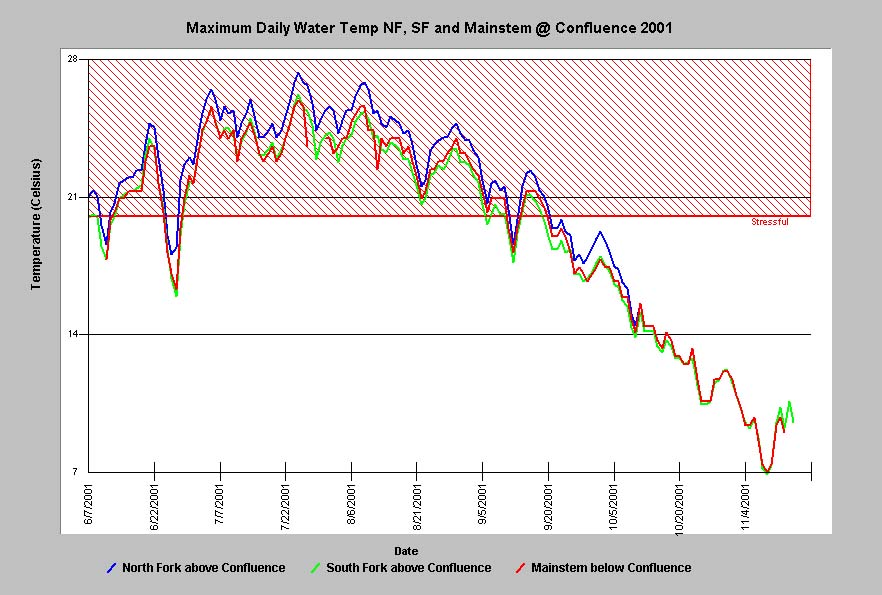 Click on image to enlarge (111K).
To learn more about this topic click Info Links
To view additional information (data source, aquisition date etc.) about this page, click Metadata
| www.krisweb.com |