
| Area | Salmon River |
| Topic | Temperature: Temp Max Nordheimer Creek Water & Air 2001 |
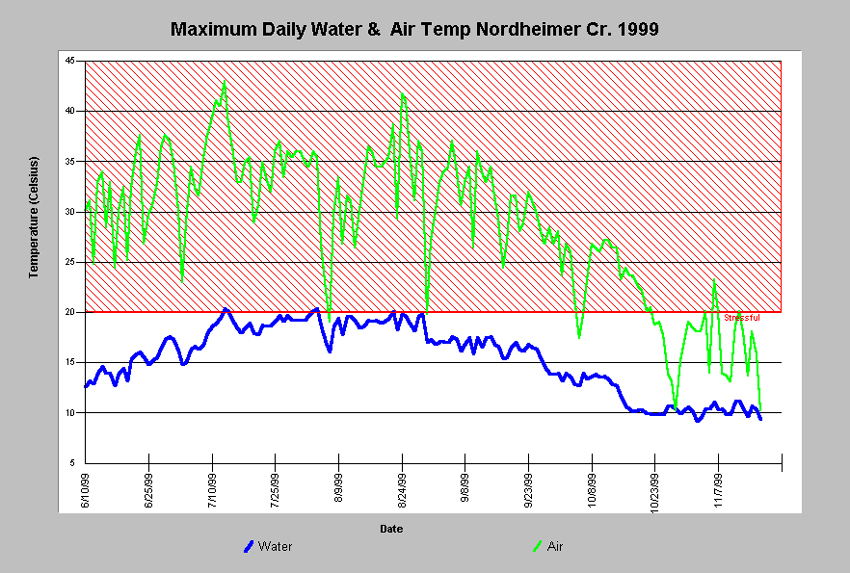
This chart shows the maximum daily water and air temperatures in Nordheimer Creek in 1999. Notice that the water temperatures reached levels stressful for Salmonids only for short periods of time during the summer months. There seems to be some correlation between these peak water temperature periods and the high air temperature periods. Data were collected by automated temperature sensors called Hobotemps, which were anchored in flowing water in the shade and in the adjacent shaded riparian area. Hobotemps were monitored by students at Forks of Salmon School, community volunteers and paid staff of the Salmon River Restoration Council. This chart was created from Chart Table NOAIRMAX99.dbf, which was derived from Source Table Salmon99.dbf.
This chart shows the maximum daily water and air temperatures in Nordheimer Creek in 2000. Notice that the water temperatures reached levels stressful for Salmonids only for short periods of time during the summer months. There seems to be some correlation between these peak water temperature periods and the high air temperature periods. Data were collected by automated temperature sensors called Hobotemps, which were anchored in flowing water in the shade and in the adjacent shaded riparian area. Hobotemps were monitored by students at Forks of Salmon School, community volunteers and paid staff of the Salmon River Restoration Council.
 Click on image to enlarge (550K).
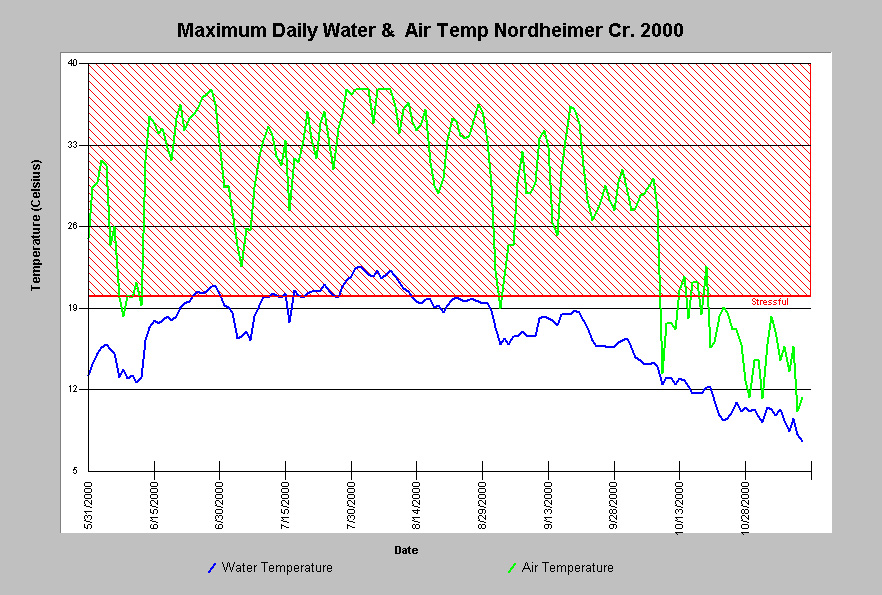 Click on image to enlarge (286K).
To learn more about this topic click Info Links
To view additional information (data source, aquisition date etc.) about this page, click Metadata
| www.krisweb.com |