
| Area | Salmon River |
| Topic | Temperature: Temp Max SF Salmon Longitudinal 2002 |
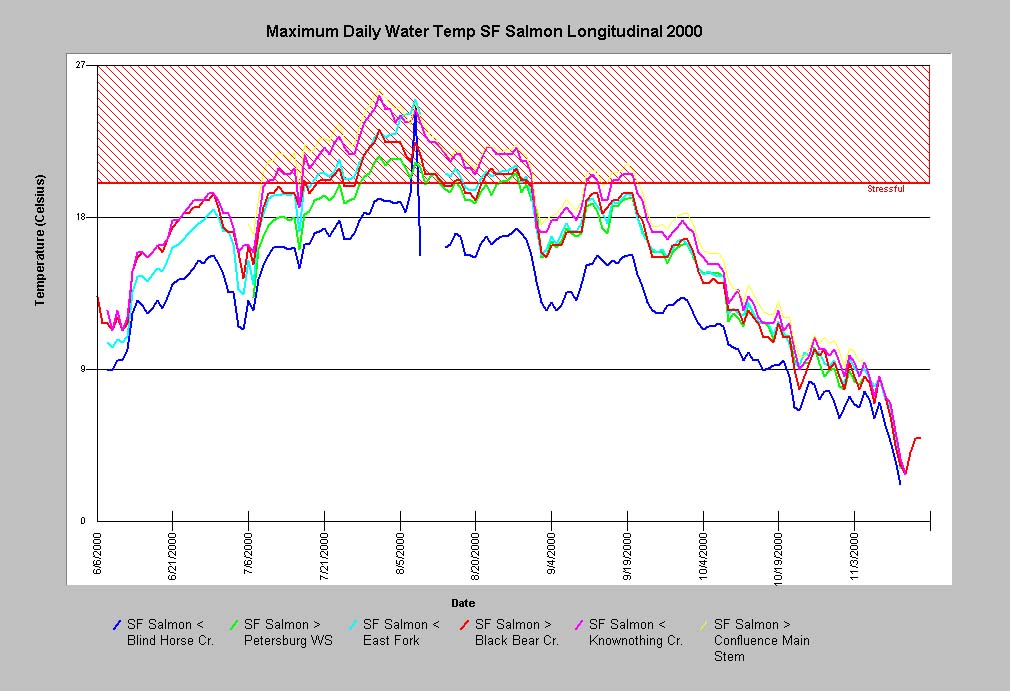
This chart shows the maximum daily water temperatures along the SF Salmon during the summer of 2000. Notice that water temperature increased the further downriver it was recorded. The data lapse for Blind Horse Creek was caused by the Hobotemp being pulled from the river and left on the bank. The temperature spike preceding was probably caused by the monitor being pulled from and then returned to the water. In all locations except for Blind Horse, water temperatures were in the range stressful to Salmonids during the heat of summer. Data for this chart was derived from automated temperature sensors called Hobotemps, which were anchored in flowing water in the shade. Hobotemps were monitored by students at Forks of Salmon School, community volunteers and paid staff of the Salmon River Restoration Council.
This chart shows the maximum daily water temperatures along the SF Salmon during the summer of 2001. Notice that water temperature increased the further downriver it was recorded. The data discrepancy for Petersburg seems to have been caused by the Hobotemp being placed in very shallow water during July and August. In all locations water temperatures were in the range stressful to Salmonids during the heat of summer. Data for this chart was derived from automated temperature sensors called Hobotemps, which were anchored in flowing water in the shade. Hobotemps were monitored by students at Forks of Salmon School, community volunteers and paid staff of the Salmon River Restoration Council.
 Click on image to enlarge (130K).
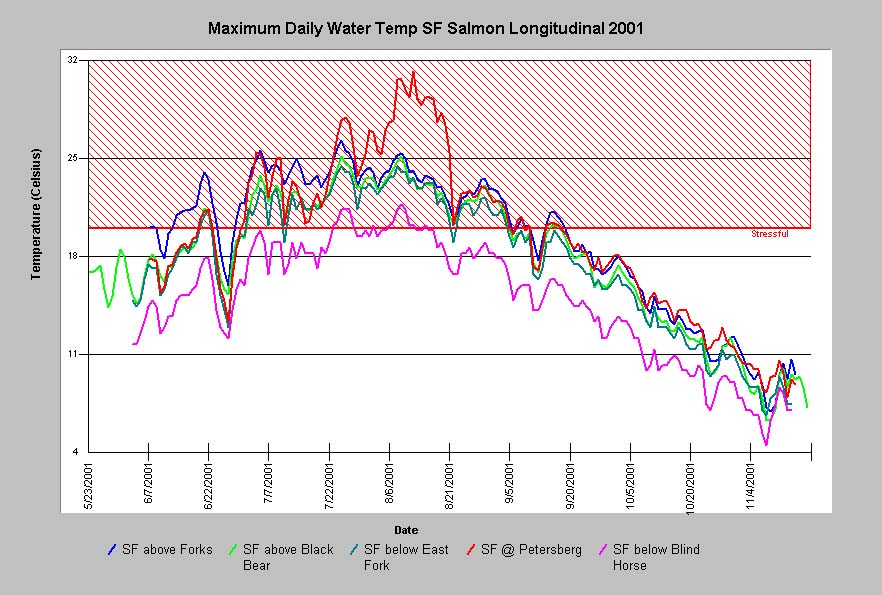 Click on image to enlarge (129K).
To learn more about this topic click Info Links
To view additional information (data source, aquisition date etc.) about this page, click Metadata
| www.krisweb.com |