
| Area | Salmon River |
| Topic | Temperature: Temp Max South Russian Cr @ North Russian Cr Bracket 2002 |
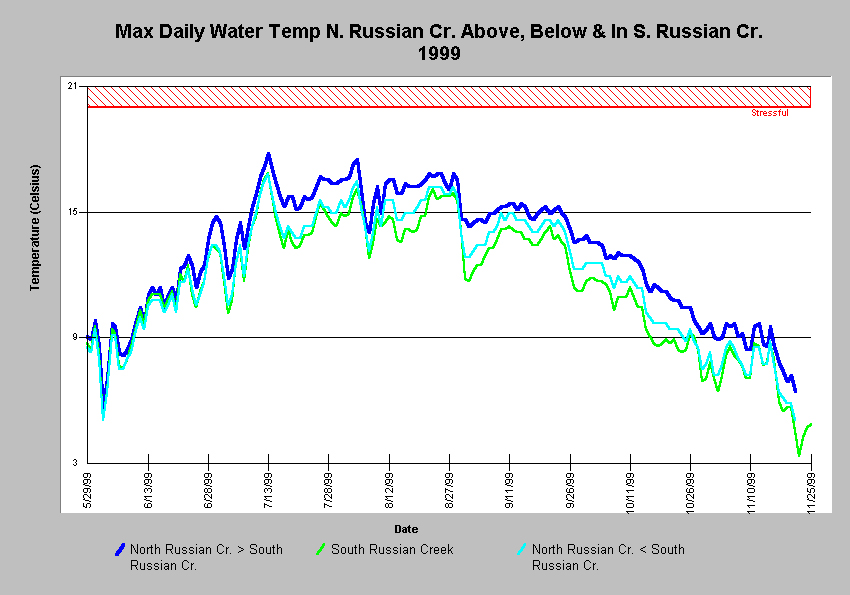
This chart shows the maximum daily water temperatures in 1999 of North Russian Creek above, below and in South Russian Creek. The water temperature in both North Russian Creek and South Russian Creek remained below the level stressful for Salmonids during the summer months. South Russian Creek appeared to have a cooling effect on North Russian Creek throughout most of the summer. Data were collected by automated temperature sensors called Hobotemps, which were anchored in flowing water in the shade. Hobotemps were monitored by community volunteers and paid staff of the Salmon River Restoration Council. Data for this chart were derived from Chart Table SRUMAX99.dbf, which in turn was filtered from Source Table SALMON99.dbf.
This chart shows the maximum daily water temperatures in 2000 of North Russian Creek above, below and in South Russian Creek. The water temperature in both North Russian Creek and South Russian Creek remained below the level stressful for Salmonids during the summer months. South Russian Creek appeared to have a cooling effect on North Russian Creek throughout most of the summer. Data were collected by automated temperature sensors called Hobotemps, which were anchored in flowing water in the shade. Hobotemps were monitored by community volunteers and paid staff of the Salmon River Restoration Council.
This chart shows the maximum daily water temperatures in 2001 of North Russian Creek above, below and in South Russian Creek. The water temperature in South Russian Creek and North Russian above South Russian remained below the level stressful for Salmonids during the summer months. The higher temperatures in North Russian below South Russian can only be explained by the location of the monitoring unit. Data were collected by automated temperature sensors called Hobotemps, which were anchored in flowing water in the shade. Hobotemps were monitored by community volunteers and paid staff of the Salmon River Restoration Council. Click on Picture* to see recent historical data.
 Click on image to enlarge (240K).
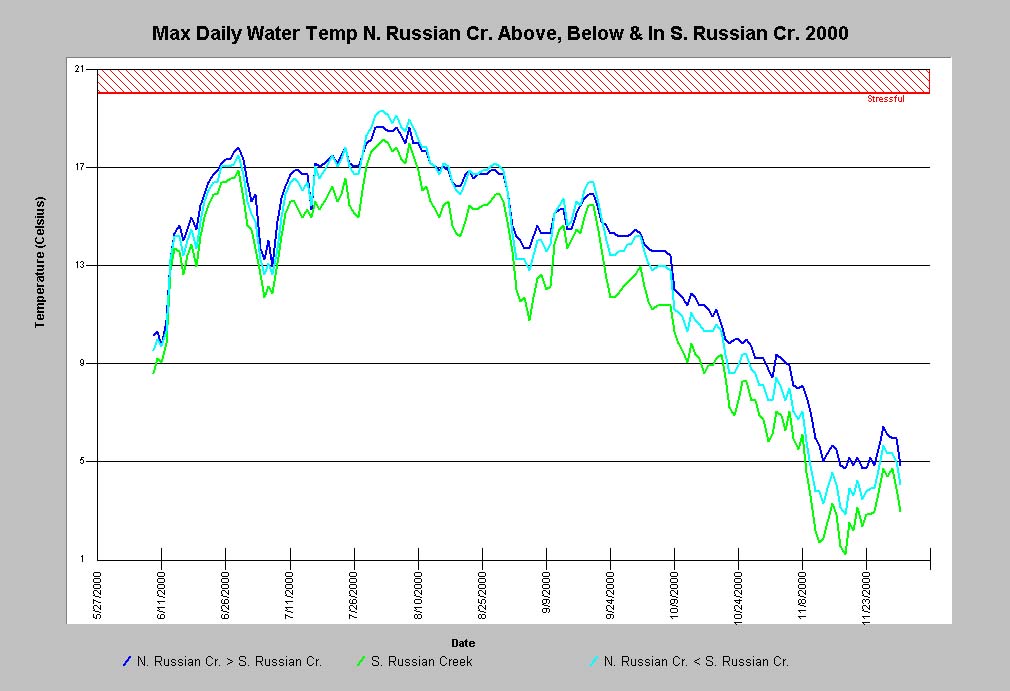 Click on image to enlarge (104K).
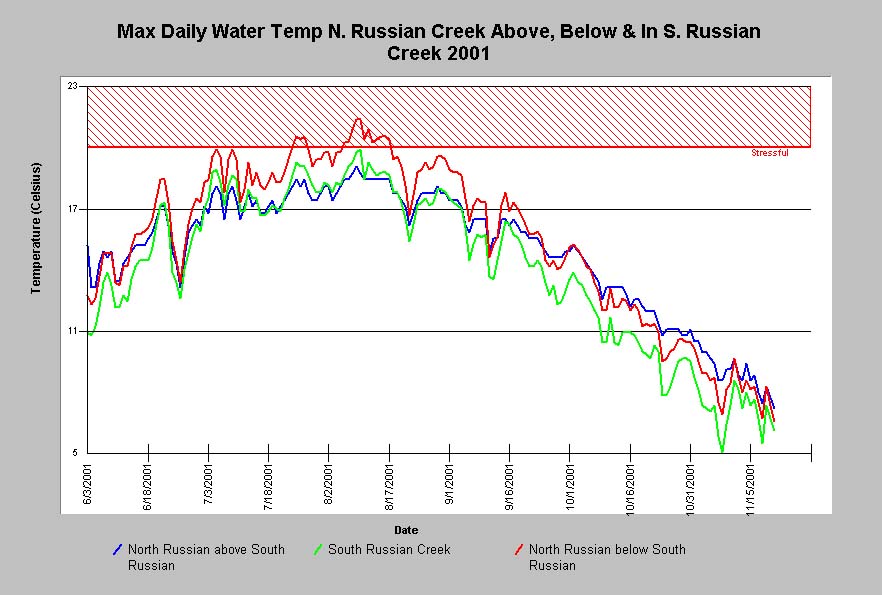 Click on image to enlarge (94K).
To learn more about this topic click Info Links
To view additional information (data source, aquisition date etc.) about this page, click Metadata
| www.krisweb.com |