
| Area | Salmon River |
| Topic | Temperature: Temp Max Taylor Cr Bracket @ East Fork of SF Salmon 2002 |
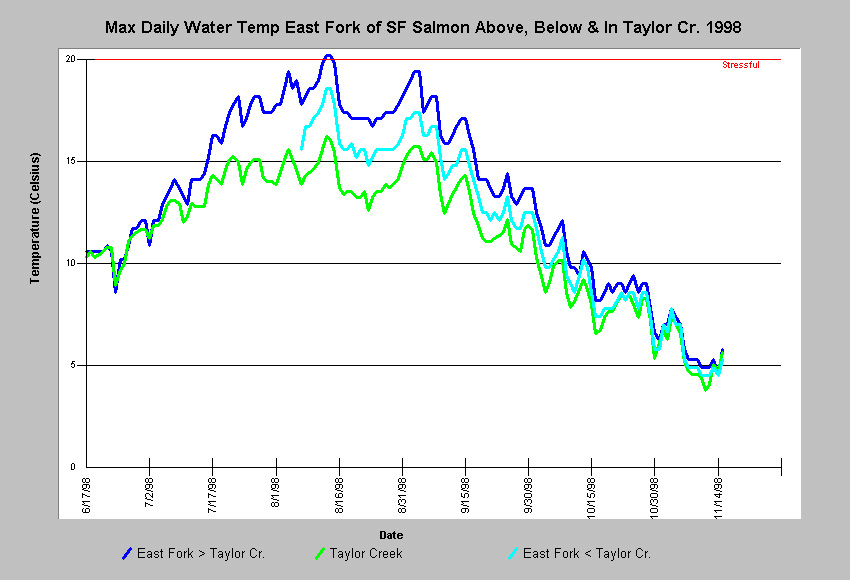
This chart shows the maximum daily water temperatures during the summer of 1998 in the East Fork of the SF Salmon River above, below and in Taylor Creek. Water temperatures in all three locations were below the level stressful to Salmonids except for one period in early August on the East Fork above Taylor Creek. Note that Taylor Creek was considerably cooler than the East Fork, and seemed to have a cooling influence on the East Fork below the confluence. The data missing from June to early August on the East Fork below Taylor Creek was due to a temperature sensor not being placed there early in the season. This chart was derived from Chart Table TAMAX98.DBF, which was derived from Source Table sfork98.dbf. Data for that table was collected from automated temperature sensors called Hobotemps, which were anchored in flowing water in the shade. Hobotemps were monitored by students at Forks of Salmon School, community volunteers and paid staff of the Salmon River Restoration Council.
This chart shows the maximum daily water temperatures in 1999 of the East Fork of the SF Salmon River above, below and in Taylor Creek. Note that temperatures remained below the level stressful for Salmonids during the entire summer at all three locations, and that Taylor Creek appeared to have a cooling influence on the East Fork. The Taylor Creek data missing between June and August was due to a malfunctioning temperature sensor. Data were collected from automated temperature sensors called Hobotemps, which were anchored in flowing water in the shade between June and November 1999. Hobotemps were monitored by community volunteers and paid staff of the Salmon River Restoration Council. The chart was derived from Chart Table Taymax99.dbf, which was derived from Source Table Salmon99.dbf.
This chart shows the maximum daily water temperatures in 2000 of the East Fork of the SF Salmon River above, below and in Taylor Creek. Note that temperatures were above the stressful limit for Salmonids during a period in late July in the East Fork above Taylor Creek. Note that Taylor Creek appeared to have a cooling influence on the East Fork during the peak of summer heat. Data were collected from automated temperature sensors called Hobotemps, which were anchored in flowing water in the shade between June and November 2000.
This chart shows the maximum daily water temperatures in 2001 of the East Fork of the SF Salmon River above, below and in Taylor Creek. Note that temperatures were above the stressful limit for Salmonids during in mid July through mid august in the East Fork above and below Taylor Creek. Note that Taylor Creek appeared to have a cooling influence on the East Fork during the peak of summer heat. Data were collected from automated temperature sensors called Hobotemps, which were anchored in flowing water in the shade between June and November 2001. Hobotemps were monitored by community volunteers and paid staff of the Salmon River Restoration Council.
 Click on image to enlarge (191K).
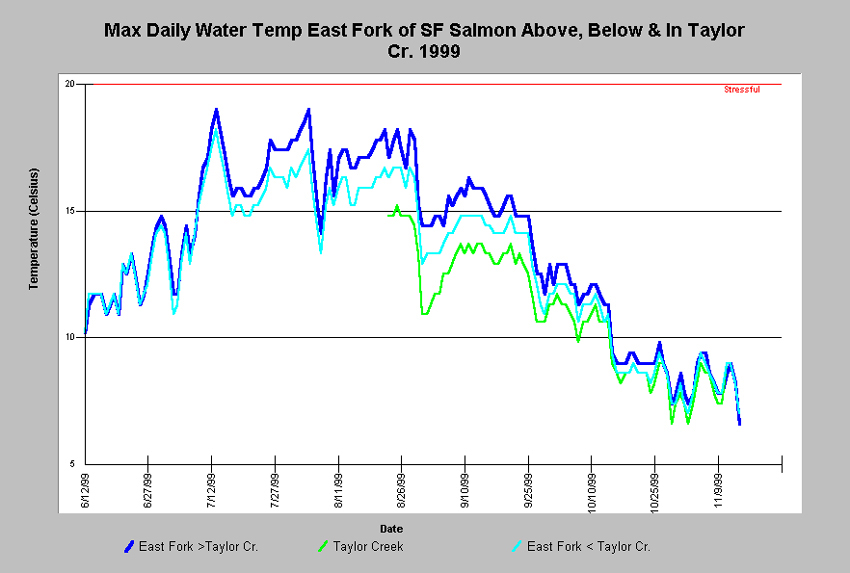 Click on image to enlarge (183K).
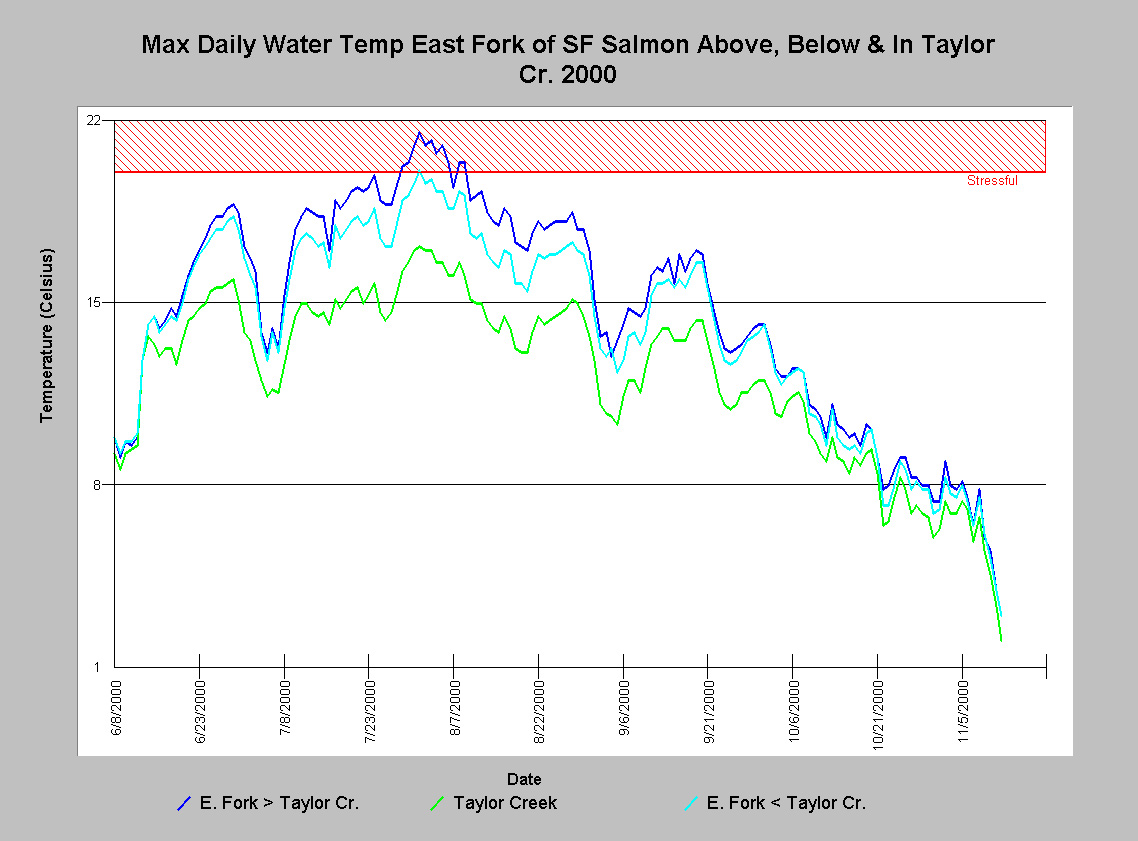 Click on image to enlarge (258K).
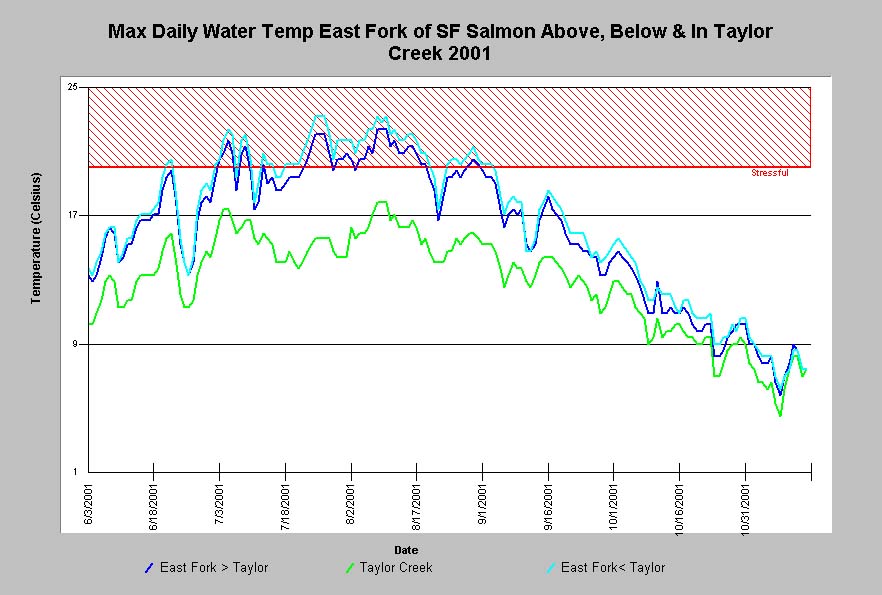 Click on image to enlarge (94K).
To learn more about this topic click Info Links
To view additional information (data source, aquisition date etc.) about this page, click Metadata
| www.krisweb.com |