| Area | Shasta |
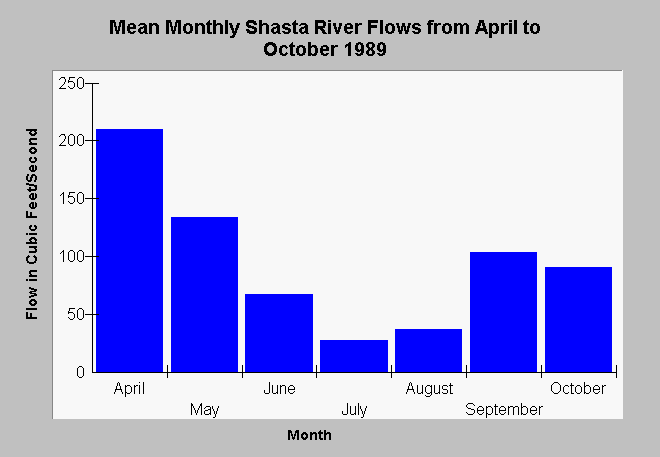
| Topic | Flow: Shasta River April-October Mean Daily 1989 |
| Caption: The Chart above shows the average daily flows by month for the year 1989. The Shasta River flow typically varies with runoff and irrigation operations during the spring and summer. As stream flows naturally decrease at the end of spring, agricultural needs for water increase. Data derived from USGS average daily flow information posted on the Internet. | |
 |
To learn more about this topic click Info Links .
To view additional information (data source, aquisition date etc.) about this page, click Metadata .
To view the table with the chart's data, click Chart Table web page.
To download the table with the chart's data, click aproct89.dbf (size 266 bytes) .
To view the table with the chart's source data, click Source Table web page.
To download the table with the chart's source data, click 3090.dbf (size 233,632 bytes)
| www.krisweb.com |
