| Area | Shasta |
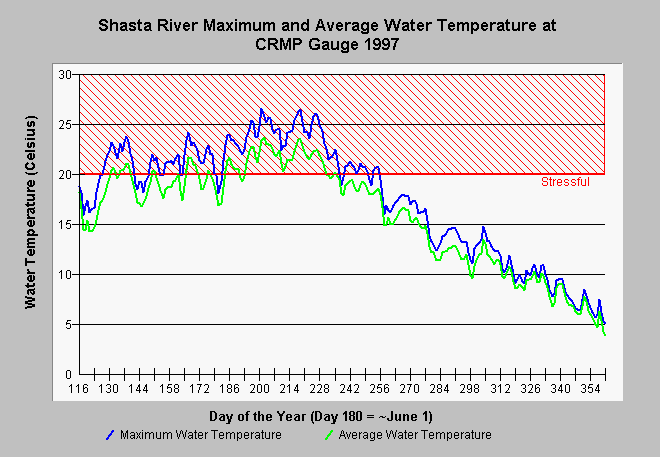
| Topic | Temperature: Maximum and Average at Montague Grenada Rd 1997 |
| Caption: This chart shows the average and maximum water temperature of the Shasta River at Montague/Grenada Road during 1997. Both the average and maximum water temperatures often exceeded stressful for salmonids (>20 C or 68 F) from late April to late July (days 120-240) but moderated in August and September. Data provided from the continuous water quality gauge operated by the Shasta CRMP. See Info Links for more information. | |
 |
To learn more about this topic click Info Links .
To view additional information (data source, aquisition date etc.) about this page, click Metadata .
To view the table with the chart's data, click Chart Table web page.
To download the table with the chart's data, click crtemp97.dbf (size 15,136 bytes) .
To view the table with the chart's source data, click Source Table web page.
To download the table with the chart's source data, click crmpms97.dbf (size 1,503,298 bytes)
| www.krisweb.com |
