| Area | Shasta |
| Topic | Conductivity: Maximum and Average CRMP Gauge 1996 |
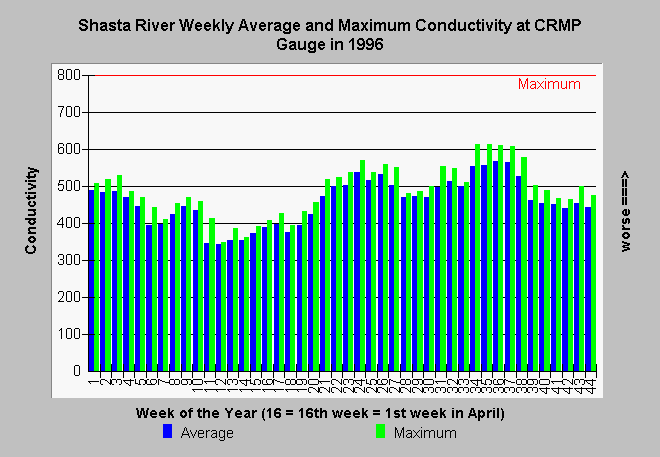
| Caption: The chart above shows the average and maximum weekly conductivity at the Montague-Grenada Road as measured by the Shasta CRMP continuous recording water quality gauge. The North Coast Regional Water Quality Control Board has a median water quality objective of 600 micro-mhos for the Shasta River, which means that the monthly average should not exceed this value. Although the maximum reading in several weeks exceeded 600 micro-mhos, the averages show that the NCRWQCB median standard for this parameter was not exceeded. Conductivity over 500 in January 1996 indicates that alkaline ground in the Shasta naturally increases in its conductivity during storm events. The highest values, however, during August and September, may have a component of agricultural waste from irrigation return water, a pattern noticed by Gwynne (1993). | |
 |
To learn more about this topic click Info Links .
To view additional information (data source, aquisition date etc.) about this page, click Metadata .
To view the table with the chart's data, click Chart Table web page.
To download the table with the chart's data, click shcon96.dbf (size 2,997 bytes) .
To view the table with the chart's source data, click Source Table web page.
To download the table with the chart's source data, click shmoncon.dbf (size 4,827 bytes)
| www.krisweb.com |
