
| Area | Middle Kootenai |
| Topic | Climate: Precipitation - Troy, MT - Monthly Min, Mean, Max |
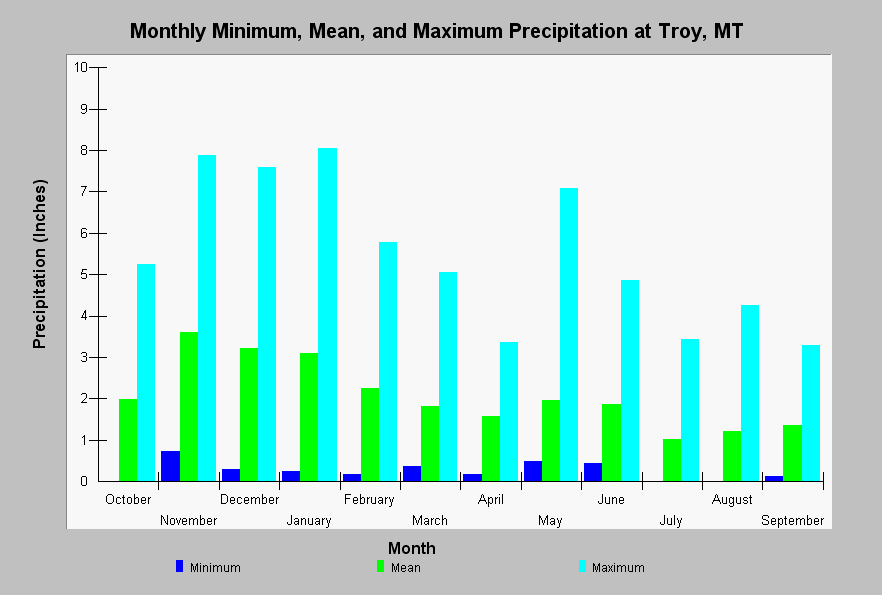
| Caption: This chart shows monthly minimum, mean, and maximum precipitation accumulation (inches) at Troy, MT. Small quantities of precipitation in the spring months can cause rain-on-snow runoff events. Highest precipitation quantities occur during the late-fall and winter months. See Info Links for more information. | |
 |
To learn more about this topic click Info Links .
To view a table of information about this data click Metadata .
To view the table with the chart's data, click Chart Table web page.
To download the table with the chart's data, click climate_precip_monthly_troy_mt.dbf (size 618 bytes) .
To view the table with the chart's source data, click Source Table web page.
To download the table with the chart's source data, click climate_precip_troy_mt.dbf (size 5,689 bytes)
| www.krisweb.com |