
| Area | Middle Kootenai |
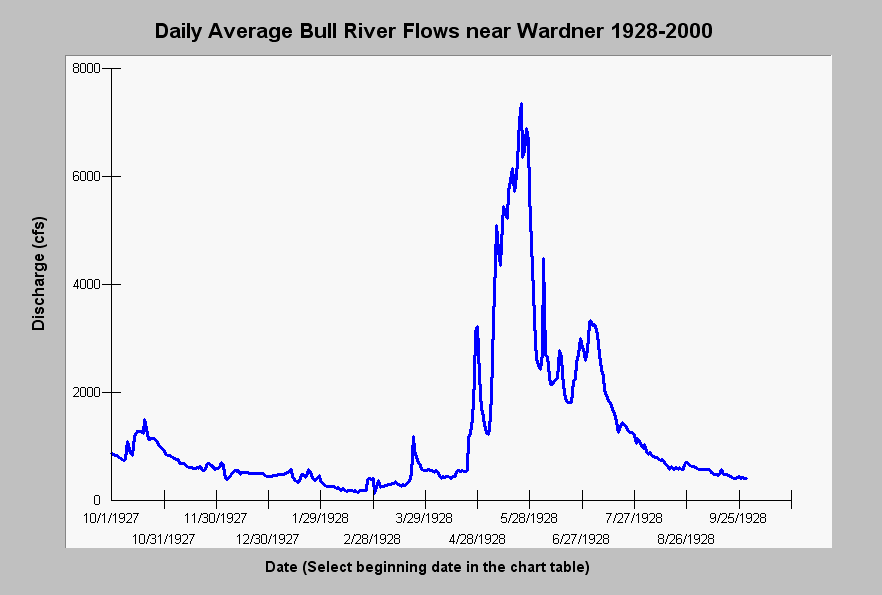
| Topic | Flow: Daily Average - Bull River near Wardner, BC - 1928-2000 |
| Caption: This chart displays daily average Bull River flows (cfs) near Wardner, BC. The hydrograph generally peaks between May through August due to snowmelt runoff. Baseflows then dominant September through April. Flow data were measured by the Water Survey of Canada and spans water years 1928 through 2000. Flow data on the Internet is only viewable for the first year of record, while all years can be reviewed from a KRIS CD version. The entire data set is available, however from the Chart Table page. See Info Links for more information. | |
 |
To learn more about this topic click Info Links .
To view a table of information about this data click Metadata .
To view the table with the chart's data, click Chart Table web page.
To download the table with the chart's data, click flow_bull_wsc08ng002.dbf (size 890,107 bytes) .
| www.krisweb.com |