
| Area | Middle Kootenai |
| Topic | Climate: Precipitation - Libby, MT - Annual Totals, 1912-2001 |
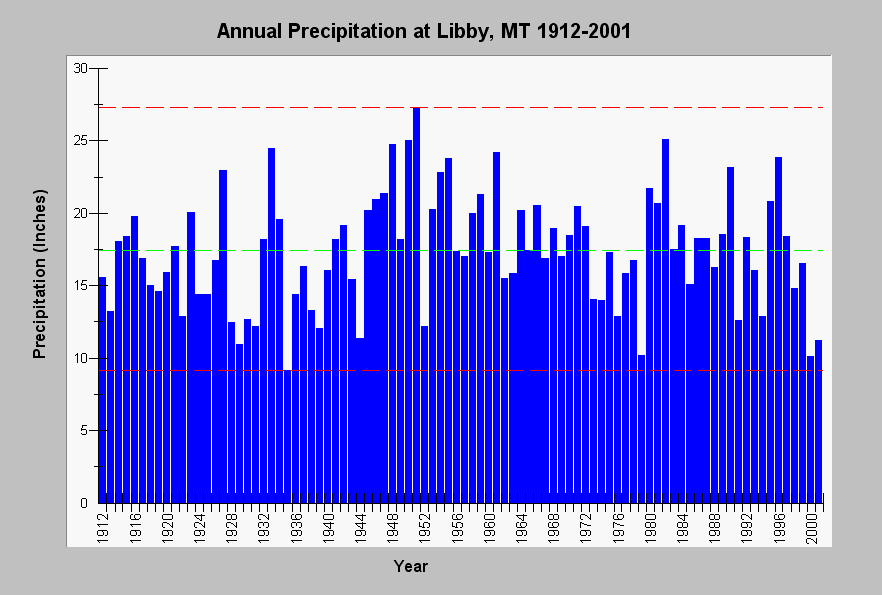
| Caption: This chart shows annual precipitation (inches) at the Libby 1NE Ranger Station, MT for years 1912 through 2001. The mean annual precipitation for the period is shown above in green (dashed-line), while the minimum and maximum are shown in red. See Info Links for more information. | |
 |
To learn more about this topic click Info Links .
To view a table of information about this data click Metadata .
To view the table with the chart's data, click Chart Table web page.
To download the table with the chart's data, click climate_precip_libby_mt.dbf (size 11,912 bytes) .
| www.krisweb.com |