
| Area | Kootenay Lake |
| Topic | Temperature: Min, Max, Avg at Boundary Creek - Upper, 2002 |
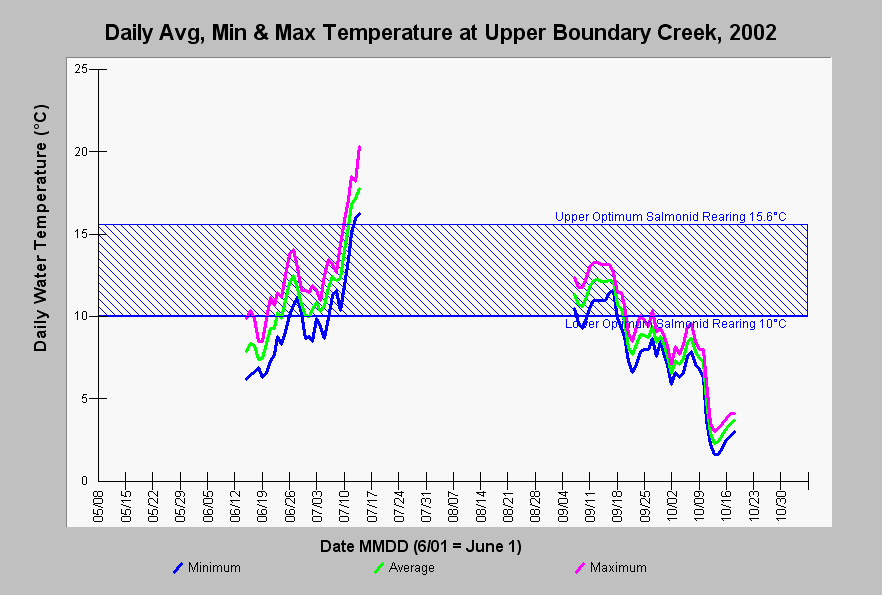
| Caption: This Chart shows the daily minimum, maximum, and average water temperature in Celsius (°C) at upper Boundary Creek for the year 2002. Data showing large diurnal swings between mid-July and early September were trimmed from this dataset because it was likely that the temperature probe was exposed to air. This missing data makes it difficult to draw conclusions. The reference value of 10-15.6°C optimum temperature range for juvenile salmonid rearing is based on McCullough (1999). See Info Links for more information. Data comes from automated water temperature data probes, contributed to KRIS by Gretchen Kruse of Free Run Aquatic Research. | |
 |
To learn more about this topic click Info Links .
To view a table of information about this data click Metadata .
To view the table with the chart's data, click Chart Table web page.
To download the table with the chart's data, click temp_koot_kruse_02_daily.db (size 51,200 bytes) .
To view the table with the chart's source data, click Source Table web page.
To download the table with the chart's source data, click tempraw_koot_kruse_02.dbf (size 941,271 bytes)
| www.krisweb.com |