| Area | Kootenay Lake |
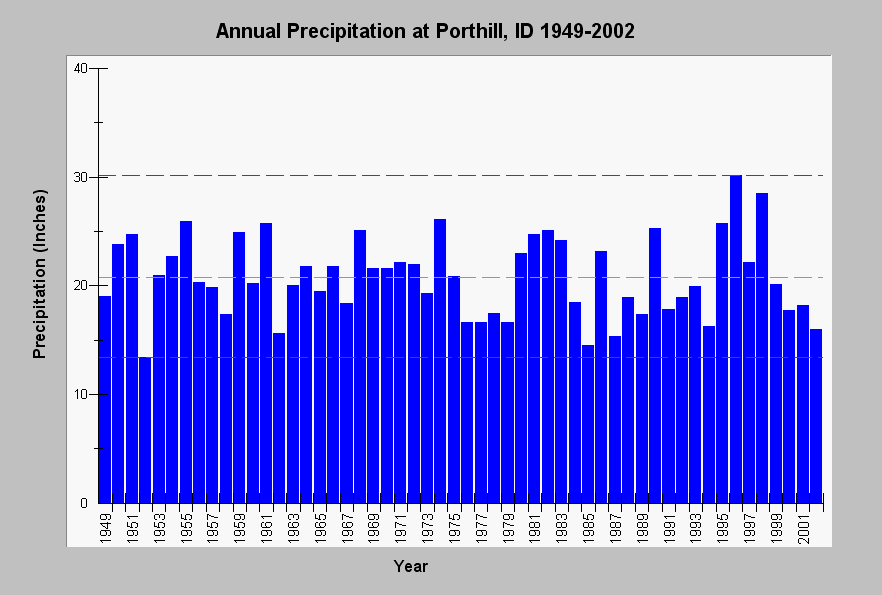
| Topic | Climate: Precipitation - Porthill, ID - Annual Totals, 1949-2002 |
| Caption: This chart shows annual precipitation (inches) at Porthill, ID for years 1949 through 2002. The mean annual precipitation for the period of record is shown above in green (dashed-line), while the minimum and maximum are indicated by a dashed red line. See Info Links for more information. | |
 |
To learn more about this topic click Info Links .
To view a table of information about this data click Metadata .
To view the table with the chart's data, click Chart Table web page.
To download the table with the chart's data, click climate_precip_porthill_id.dbf (size 7,340 bytes) .
| www.krisweb.com |
