
| Area | Basin-wide/Regional |
| Topic | Flow: Mattole at Petrolia, Low Flows by Year, 1912-2000 |
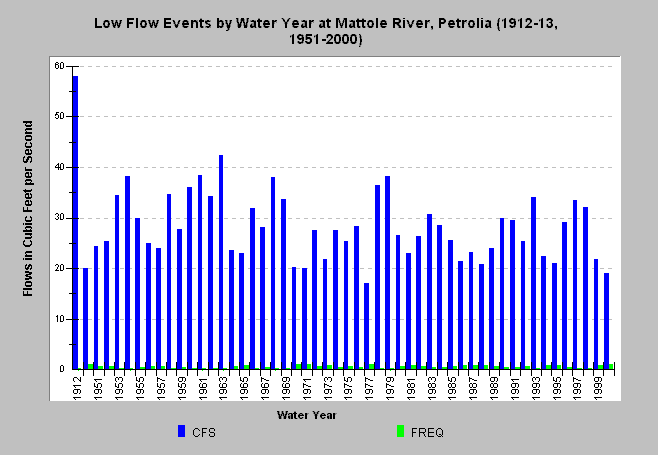
| Caption: This chart displays lowest annual average daily flow in cubic feet per second by water year for the Mattole River at Petrolia beginning with the water year 1912. The lowest recorded flow was 17 cfs in 1977. The low flow of 19 cfs in 2000 ranks second. The data is from a USGS stream gauge. The water year typically runs from October 1 of the calendar year prior. | |
 |
To learn more about this topic click Info Links .
To view a table of information about this data click Metadata .
To view the table with the chart's data, click Chart Table web page.
To download the table with the chart's data, click flopetr_lowann.dbf (size 3,346 bytes) .
To view the table with the chart's source data, click Source Table web page.
To download the table with the chart's source data, click matpetfl.dbf (size 309,104 bytes)
| www.krisweb.com |