
| Area | Basin-wide/Regional |
| Topic | Flow: Mattole at Petrolia, Maximum Average Daily Flow, 1912-1995 |
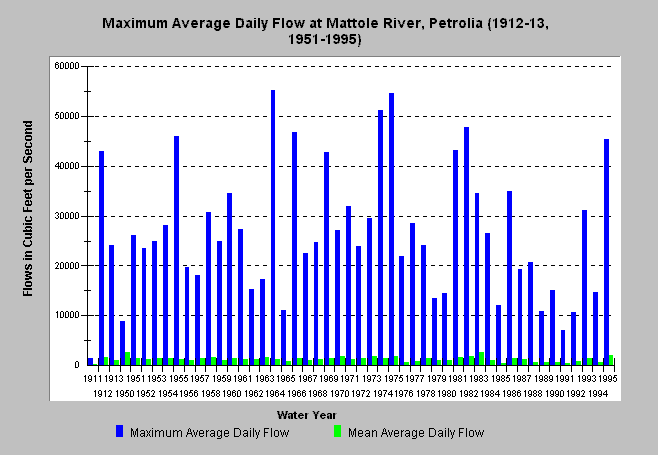
| Caption: This chart shows the maximum average daily flow in cubic feet per second by water year for the Mattole River at Petrolia beginning with the water year 1912. The highest average daily flow was 55,200 cfs in 1977. The low flow of 54,600 cfs in 1975 ranks second. Green bars show the mean average daily flow and show that 1950, 1983, and 1995 provided the highest total annual runoff. .The data is from a USGS stream gauge. The water year typically runs from October 1 of the calendar year prior. | |
 |
To learn more about this topic click Info Links .
To view a table of information about this data click Metadata .
To view the table with the chart's data, click Chart Table web page.
To download the table with the chart's data, click matpetfl_summary.db (size 8,192 bytes) .
To view the table with the chart's source data, click Source Table web page.
To download the table with the chart's source data, click matpetfl.dbf (size 309,104 bytes)
| www.krisweb.com |