
| Area | Basin-wide/Regional |
| Topic | Flow: Mattole at Petrolia, Peak Events Ranked, 1912-2000 |
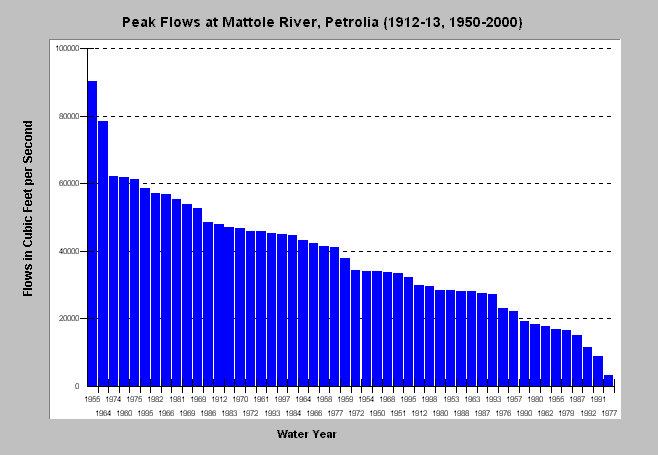
| Caption: This chart displays the highest peak flow events for the Mattole River at Petrolia for the years of record. Click on individual bars or see Chart Table for peak flow in cfs. | |
 |
To learn more about this topic click Info Links .
To view a table of information about this data click Metadata .
To view the table with the chart's data, click Chart Table web page.
To download the table with the chart's data, click flopetr_peakevents.dbf (size 3,086 bytes) .
| www.krisweb.com |