| Area | Basin-wide/Regional |
| Topic | Climate: Maximum Daily Rainfall at Petrolia, CA |
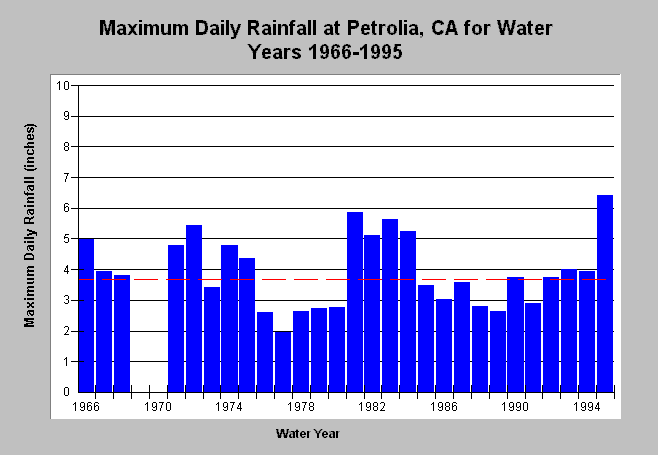
| Caption: This figure shows the maximum daily rainfall for water years 1966 to 1995 at the DWR rain gage # F70 6835 01 located at Petrolia, CA. Minimum and maximum occurred during WY 1977 (1.97 inches) and WY1995 (6.42 inches), respectively. The mean maximum daily rainfall (red dashed line) is 3.94 inches. Note that 1969-1970 is missing from record. | |
 |
To learn more about this topic click Info Links .
To view a table of information about this data click Metadata .
To view the table with the chart's data, click Chart Table web page.
To download the table with the chart's data, click rainfall_petrolia.dbf (size 1,240 bytes) .
| www.krisweb.com |
